Weather and the Timing of Vineyard Actions
The second of two notes. The first, Modeling Berry Maturation, describes the fruit: how a season is built stage by stage and what the berry does between veraison and harvest. It stops short of the pick decision. This note focuses on decision support and how our dashboard was developed
Introduction
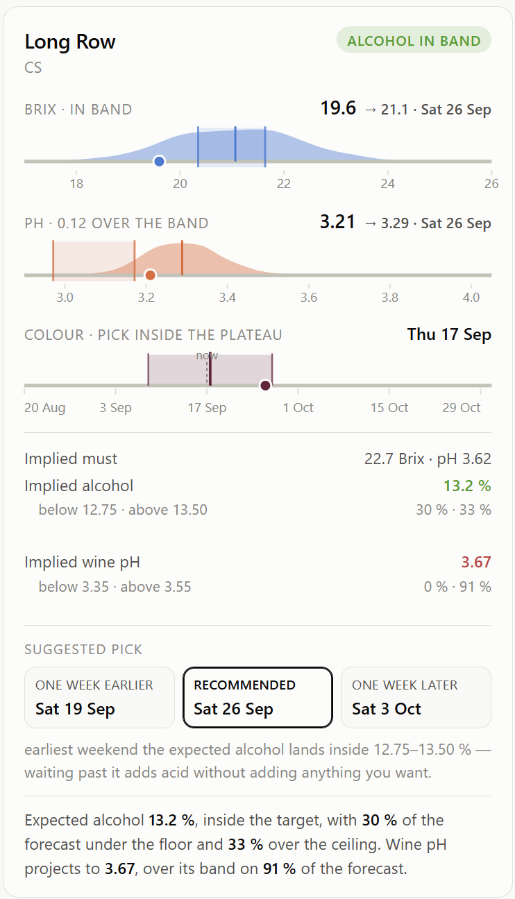
This note is about making well-founded decisions in the vineyard — when to prune, when to spray, and most importantly, when to harvest. In the past, we made many of these decisions on experience and gut feel. With Anthropic's Claude Code, we analyzed our vineyard record, built extensive statistics, and developed quantifiable goals and clear decision rules for when to harvest.
Much of the statistics depend on the season's weather pattern. So, to start, we need reliable, detailed weather data specific to our location. This is covered in Part 1.
Next, we need to put vine and berry development in the context of the season's weather pattern. The weather dictates the timing of vine development stages and the corresponding vineyard actions, like pruning and spraying against disease. Nothing new here, just better statistics on what happened when. This is covered in Part 2.
Part 3 is the interesting bit: developing sound quantitative decision rules for when to harvest. The process runs backward. We start by defining the wine we want to end up with, in terms of alcohol level, acidity, and phenolics. Then we work backward through our fermentation statistics to see what those goals mean for the must's Brix, pH, and phenolics at the start of fermentation. From there, we track backward again to the measurements we want to see in the berry samples from the vineyard before we decide to harvest.
We conclude with a description of the real-time dashboard we built to monitor berry development and suggest optimal harvest dates for each block. On the right is a preview the harvest recommendation made on Sept.16 for the LongRow Cabernet Sauvignon block,
Part I — A weather record you can trust
In the past, we used our weather stations to get a historical view of how a season evolved and to compare it with past years. We started with one Davis Vantage Pro in the lower vineyard in 2012. We added a second in the upper vineyard in 2021, filling occasional gaps from technical faults with data from other stations. When we analyzed that record with Claude, we were surprised to find significant errors and gaps.
1 The failure that does not announce itself
Over fifteen years, the record accumulated the usual damage—outage codes, missing months, physically impossible days. The algorithm found all of it. The interesting failure is the other kind: for two multi-month stretches the station reported temperatures that are entirely plausible and simply wrong. We found them only by comparing our data against nearby stations.
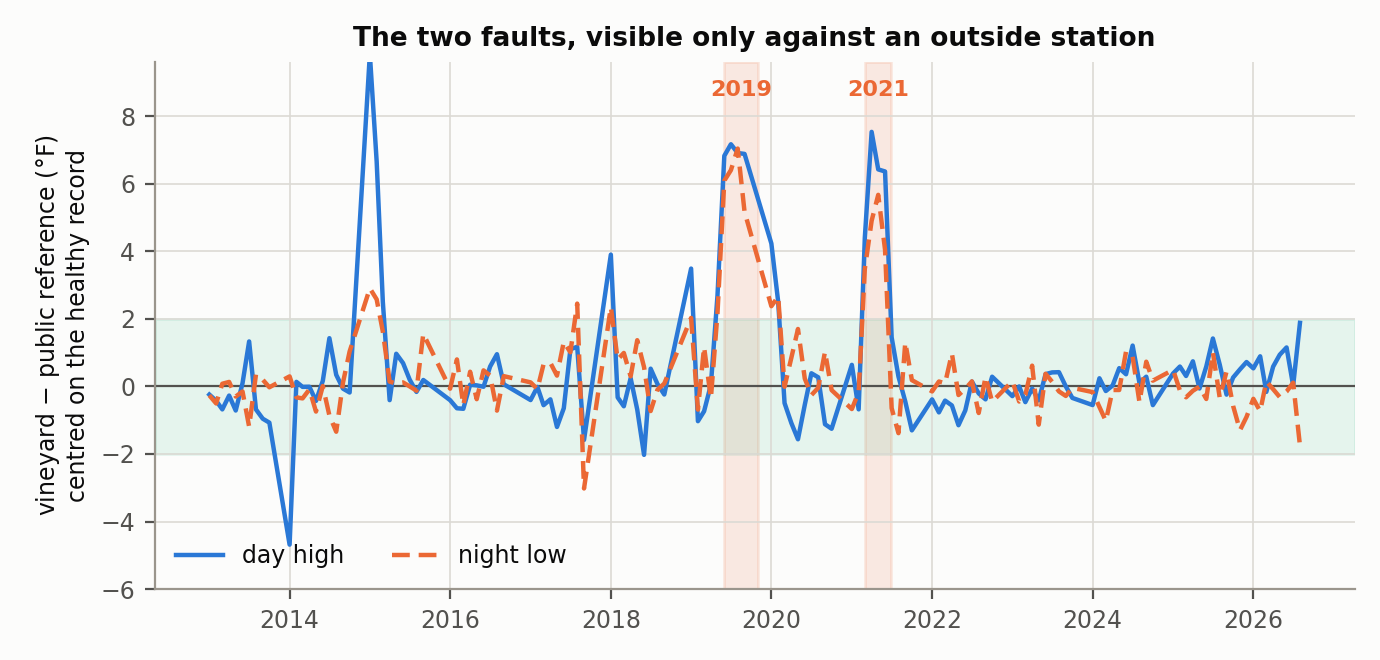
Figure 1. Our station against Los Altos RAWS, fifteen kilometers away at similar elevation, as a monthly mean centered on the offset the healthy record carries. Across 127 healthy months, the two agree within about two degrees 92% of the time. In the shaded windows the day high and the night low rise together by four to seven degrees — the signature of a whole-station offset, not of weather.
An audit for gaps, zeros, and impossible orderings finds nothing there. Every reading is in range, every day ordered correctly, every month complete. Two things give the fault away: the day high and the night low move together by the same amount, which weather does not do and a failed radiation shield does; and six to eight neighboring stations show nothing.
Over the ripening window those two vintages' degree-day totals were inflated by roughly a quarter, and they read as our two hottest on record. Rebuilt, 2019 ranks sixth of fifteen and 2021 ninth; the genuinely warm years are 2024, 2020 and 2014. Every vintage comparison and tracker calibration that used raw 2019 or 2021 temperatures was wrong, including two of this project's own summary notes. A decade of internal consistency checking did not surface it; a week of comparison against a public station did.
2. Rebuilding from public stations
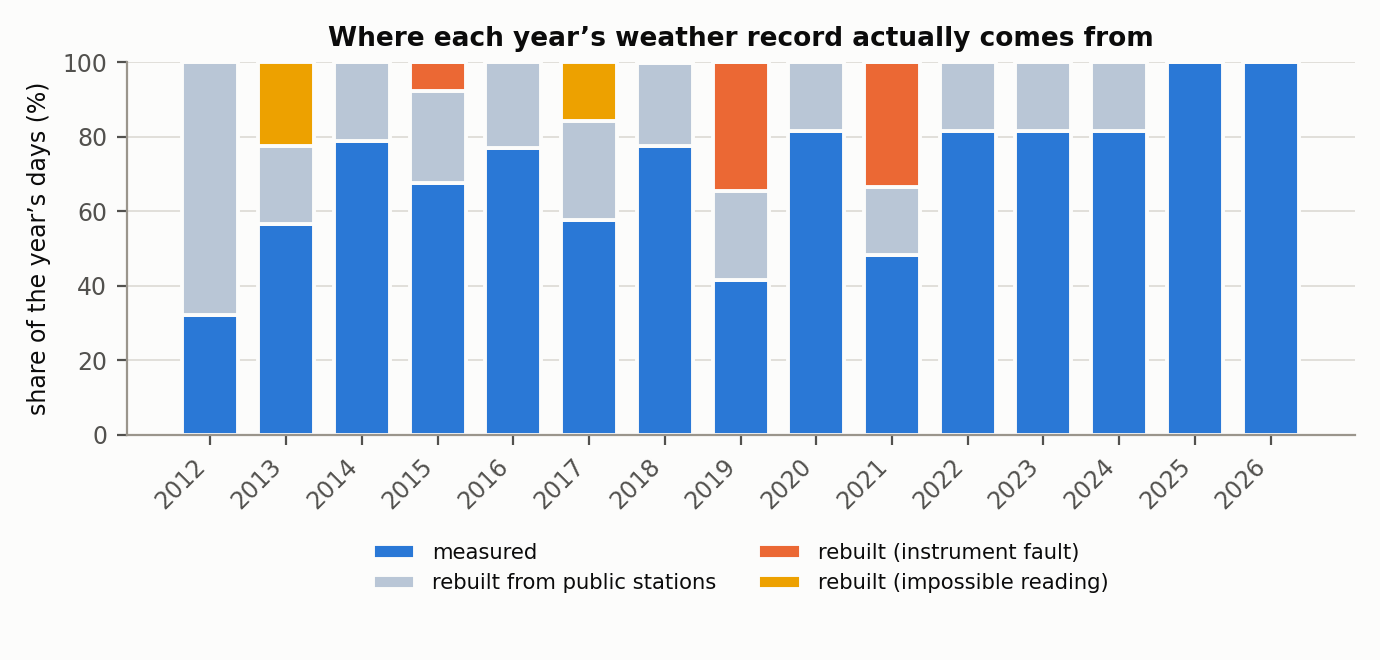
Figure 2. Where each year's record comes from. Blue is measured; pale grey is rebuilt from the public network; orange and yellow are days the station reported, but that were rejected. 2012 had no station data at all and is now a third measured, from a thirty-minute archive recovered in September 2026.
The repair and the gap-fill are the same machinery. We pulled nine public stations from the NOAA and CoCoRaHS networks. We kept five: a fire-weather station fifteen kilometers away at similar elevation, a ridge station to the west, the valley-floor airport, two more to reach the earliest years, and a volunteer rain gauge three kilometers away. None of them is our site; the differences reflect the local terrain.
Two details make this better than a naive regression. The high and the low are different problems: the high is a same-day regression on three reference highs, but cold air drains downslope here after midnight in a way a valley station cannot see, so the night model needs the following day's reference minima, the diurnal range, and a wet flag. And each reading enters interacted with an annual sine and cosine, because a ridge and a hillside do not relate the same way in January as in July.
Fitted on trusted days only and validated leave-one-year-out, the transfer functions land at about two degrees of error on both. We then discarded the fault windows and re-predicted them.
The uncertainty to attach to a season total is about 4%, with a worst observed case near nine, from rebuilding nine complete healthy years and comparing them against what the station recorded.
A thirty-minute interval archive for 2012 — the one year with no station data — surfaced on a back-up disk and gave an unplanned test. Against 117 recovered days, with no station data anywhere in that year to help it, the model returned 1.6 °F mean absolute error on both the day high and the night low. That is better than the fitted claim, on the hardest year in the record.
3. Counting heat
We measure accumulated heat as Growing Degree Days: an hourly integration of the measured temperature, bracketed at 55 and 85 °F. Textbooks use a simpler method, assuming a sine-wave temperature pattern from only the daily minimum and maximum. Tested against our integral on 3,678 clean days, every maximum/minimum reconstruction runs high — a raw sine overstates a season total by 15 % — because a real day is skewed, with a brief afternoon peak and a long overnight cooling, and a symmetric curve overweights the warm hours.
Base 55 with an 85 °F cap is our own bracket. The industry standard, Winkler and Amerine, uses base 50, April to October, with no upper cutoff. Our totals are internally consistent across fifteen years and useful for that. They are not Winkler regions and cannot be quoted as such.
Part II — What the vineyard does, and when
Since 2016, we have logged all our working hours in the vineyard by task type and block. This helps us build a view of what happens where and when. More importantly, it lets us estimate whether elapsed time or accumulated heat governs each stage of development.
1. The operations record
The actions log became a real record in 2016. Over the eleven seasons since, it holds 1,827 dated actions and about 5,100 person-hours across 1,158 distinct working days, each carrying per-block acreage and labor, which makes a per-block date possible.
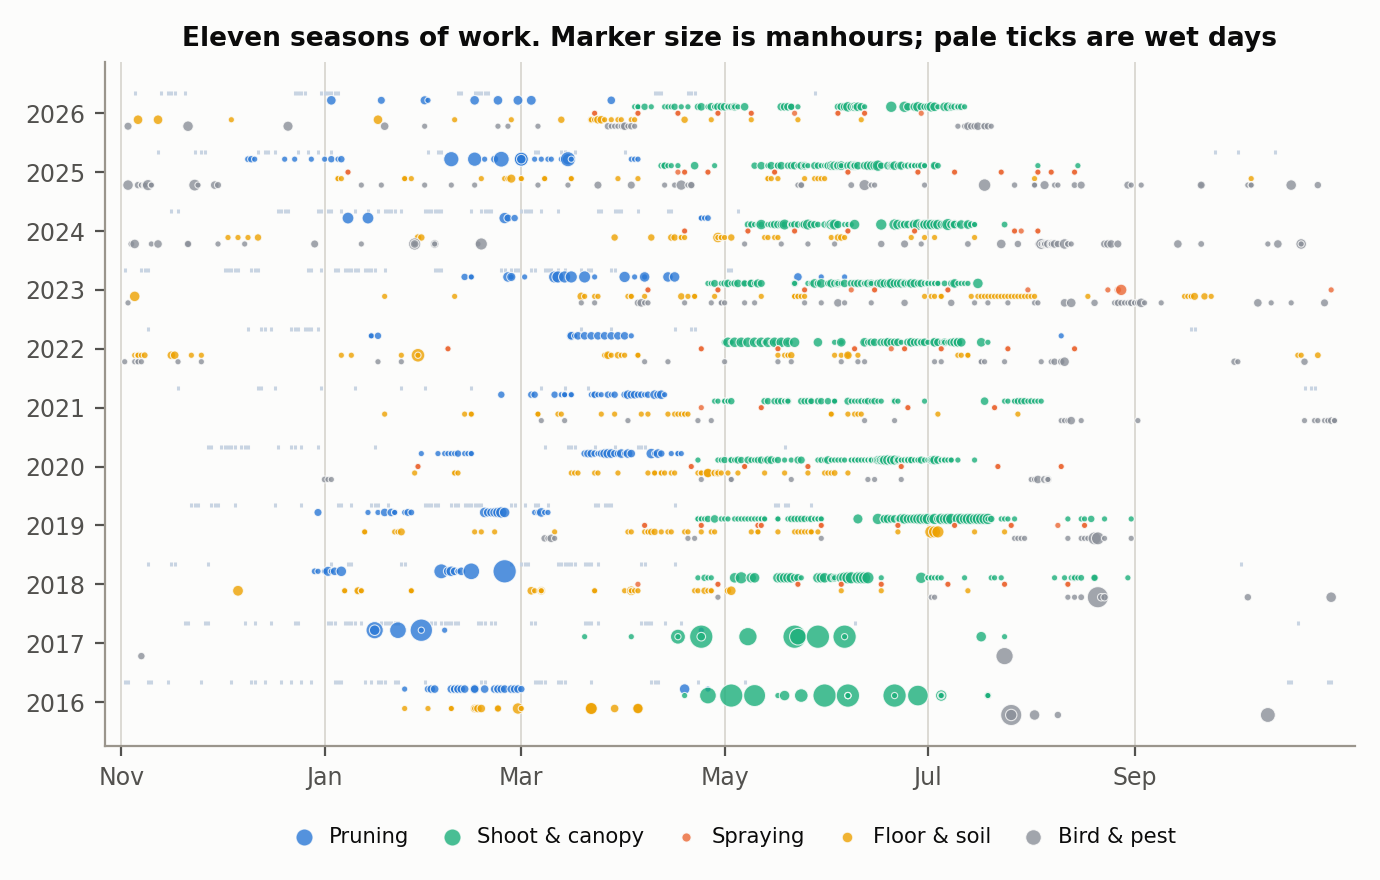
Figure 3. Eleven seasons of work, laid out on the season rather than the calendar year. Each dot is a logged action, sized by person-hours; the pale ticks along the top of each row are days with more than a tenth of an inch of rain. Pruning through the winter, canopy work from April, spraying through the spring, and the long quiet of late summer.
2. Which clock each operation runs on
Is an operation scheduled on the calendar, or on the vine? The test is whether the date is more repeatable across seasons as a day of the year or as an offset from a phenological stage.
Pruning runs on the calendar and on available time, and the companion note establishes that this costs nothing: pruning dates do not move budbreak over the range we prune across.
The first shoot-management pass runs on the vine. Anchored to budbreak, its spread falls to 10.6 days against 13.6 on the calendar, and it tracks budbreak at r = +0.63, going on about four weeks after — the one operation whose purpose is tied to a vine stage.
The last spray of the season looks at first as though it tracks veraison too, but the apparent signal rests on a single record, and under the definition the rest of this section uses it survives only weakly, at r = +0.46.
3. Pest management
The spray log spans 2009–2026 without gaps and contains 192 records, 181 relevant to mildew.
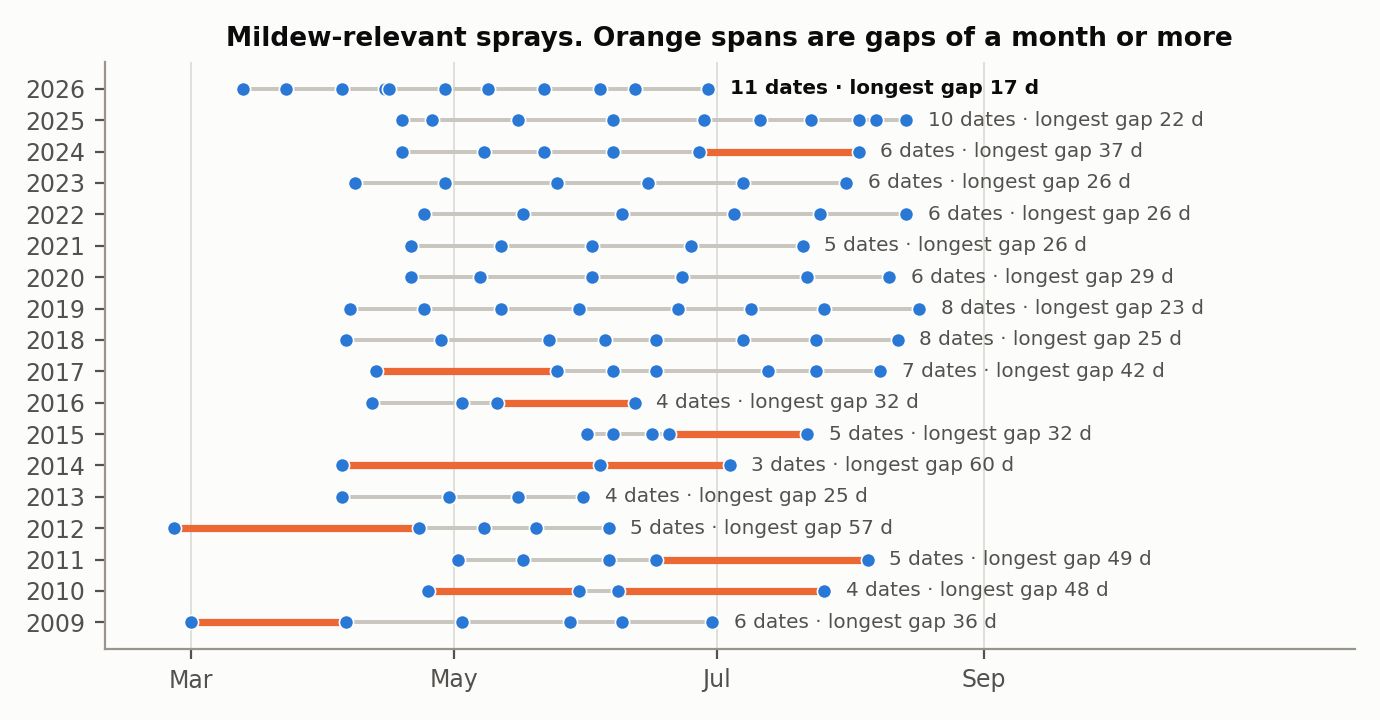
Figure 4. Every mildew-relevant spray date, season by season. Orange spans mark intervals of a month or more. The program tightens visibly over the record.
2026 carries the most mildew-relevant dates of any season and the shortest longest gap — seventeen days against a next-best of twenty-two.
Mildew pressure modeled with the standard UC Davis index saturates: in 2026 it stood at or above the epidemic threshold on 111 of 176 days. It cannot schedule anything by itself, but it can put each interval against the pressure that ran through it and say when the epidemic phase opened.
Fruit chemistry feeds back into a vineyard decision at exactly one point. Past roughly 12 °Brix, the fruit acquires ontogenic resistance; powdery-specific sprays can stop, and the operative question becomes bunch rot—which is why a last application in late June is not a problem.
4. Two usual risks that we are not exposed to
We don't worry about frosts. In 5,349 days, there are eighteen nights at or below freezing, fifteen of them in November, December, or January. The only three outside that window — 19 and 22 February 2018, and 22 February 2023 — fall five to six weeks before their season's budbreak. In all fifteen seasons, the number of frost nights between budbreak and three weeks after it is zero. Frost here is real and out of season; it belongs on the history table and should not acquire a spring alarm or a pruning rule.
Rain does not constrain our harvest. Across the 67 recorded picks, the median rainfall in the fortnight before a pick is zero. Four picks saw more than a quarter-inch in that window, and none saw more than a quarter-inch in the three days before. Only two seasons had meaningful rain inside the harvest span at all. There is no rain race here, no dodge-the-front decision, no botrytis-driven early pick anywhere in the record.
Without rain, our harvest timing depends entirely on berry ripeness. That should make the timing decision easier.
Part III — Timing the harvest
Historically, we timed our harvest by experience and gut. We tested berries every week and measured Brix (sugar), pH (juice acidity), and anthocyanins (phenolic compounds in the berry skins that drive color and mouthfeel). We targeted Brix at 23, pH below 3.5, and maximum anthocyanins.
With Claude's help, we changed our approach. Using extensive statistics and a berry-development model, we now start by targeting the resulting wine's characteristics and work backward. We monitor berry development and project berry chemistry 10 days ahead—time enough to mobilize the harvest crew. For a description of the berry model, see the companion note.
1. The target, and where the picks land
Our targets are set on the finished wine: a) alcohol between 12.75 and 13.50%, b) pH of 3.35 to 3.55 for Cabernet Sauvignon (Long Row and Short Row) and 3.50 to 3.70 for Merlot, Cab Franc and Petit Verdot, and c) color at or near its peak.
Against these targets, our past harvests have, on average, been too late.
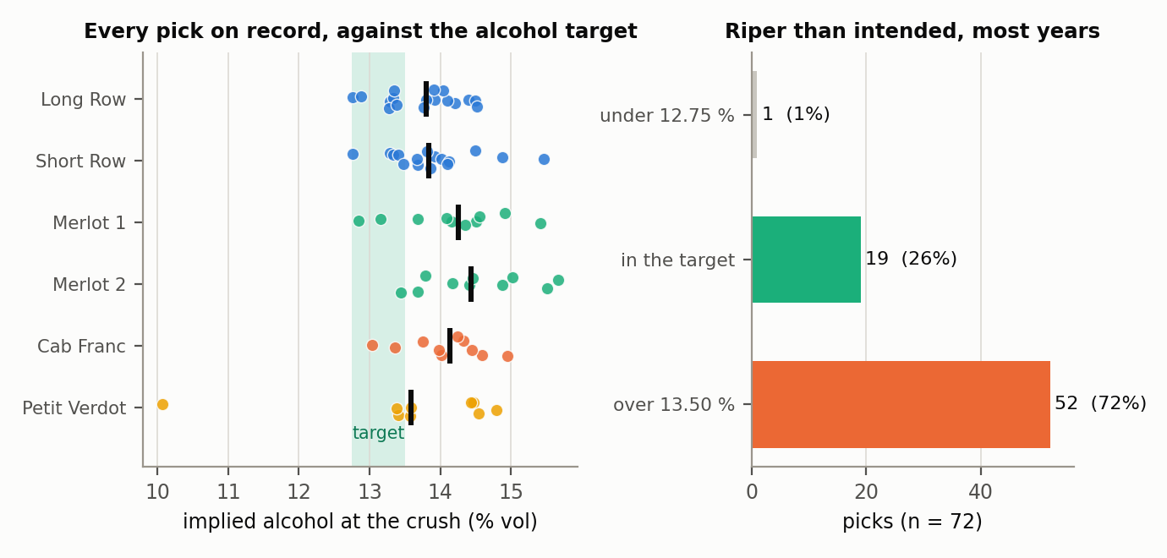
Figure 5. Every per-block crush reading on record, converted to implied alcohol at a factor of 0.58. The heavy tick is each block's median. Right: the same 72 picks sorted into the target and the two ways of missing it.
For each of the 72 block harvests, we converted the measured Brix of the must at the start of fermentation into the alcohol level at the end, using a conversion factor of 0.58—the value we derive in section 5, assuming the fermentation finishes dry. In 72 % of cases, the alcohol exceeded the ceiling of 13.5 %; 26 % landed in the target, and a single pick came in under it. The median pick was 14.00%, half a point above the top of the band.
The miss is one-directional; it is not scatter—it is a systematic habit of picking late. Through 2025, our goal was a sugar floor of about 23 Brix and a pH ceiling of about 3.50, with no upper bound on ripeness. Every one of those 52 over-ripe picks satisfied that floor.
2. Three criteria, and how rarely they agree
The pick is a conjunction: color at or near its peak, sugar inside its band, acid under its crest. The graphic shows how rarely all three have coincided.
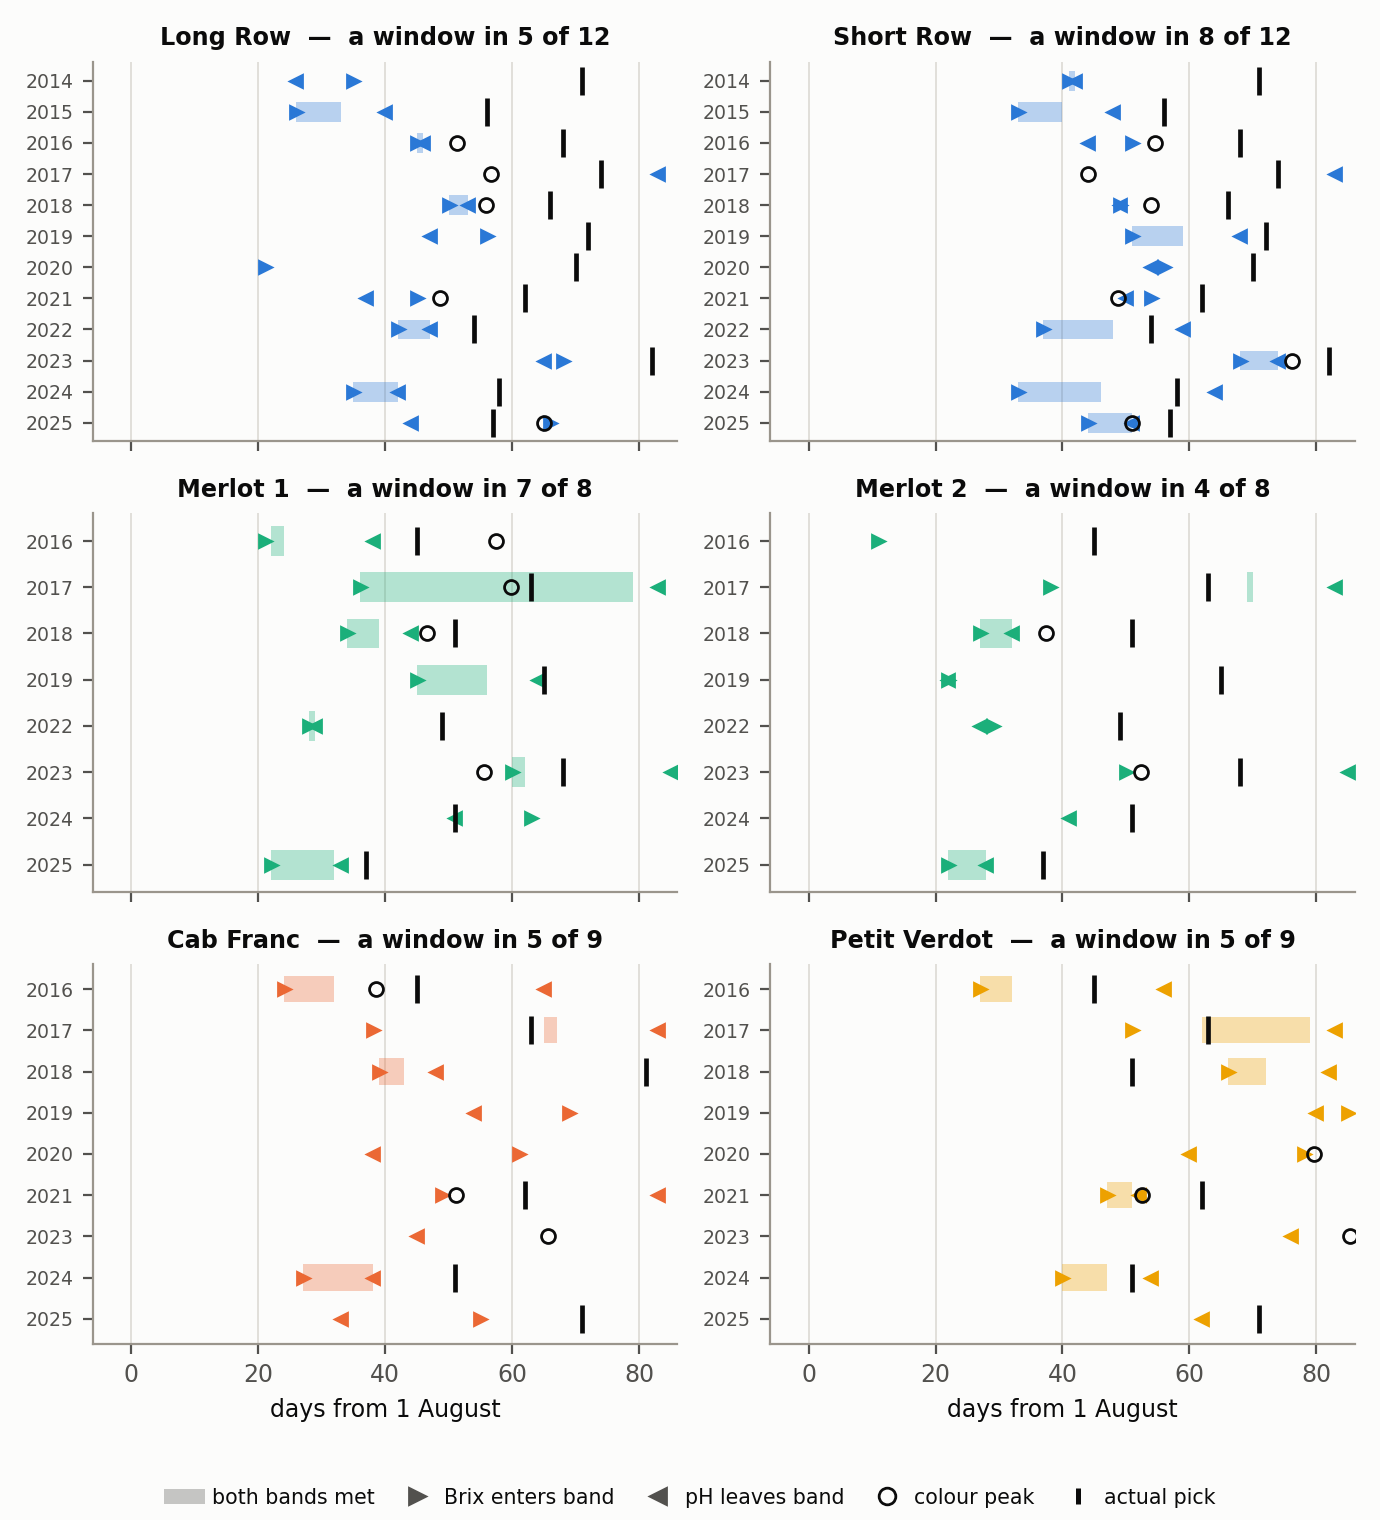
Figure 6. Every block-vintage with a pick on record, one panel per block. The shaded bar is the window in which both chemistry bands are met; the arrows mark the day sugar enters its band and the day acid leaves; the open circle is the color crest, and the vertical tick marks the pick that happened. Bars are absent wherever no such window existed.
A window in which both chemistry bands are met exists in 34 of 58 block-vintages, with a median width of six days. At the pick that actually happened, both were met in one window. The per-block spread is wide: Merlot 1 found a window in 7 of 8 seasons, Merlot 2 in only 4 of 8, and the two Cabernet Sauvignon blocks in 5 and 8 of 12.
The 24 block-vintages without a window divide in a way that is more useful than the count. Six never have sugar inside the band at all, and two have acid already gone throughout. The remaining sixteen are cases where each criterion is individually attainable, and the two never coincide—the sugar arrives after the acid has left. That is a timing problem rather than a ripeness problem, and it is the characteristic failure on our site.
3. What a day of waiting costs
If the targets are not fully attainable, every pick decision is a compromise, and the trade-offs matter.
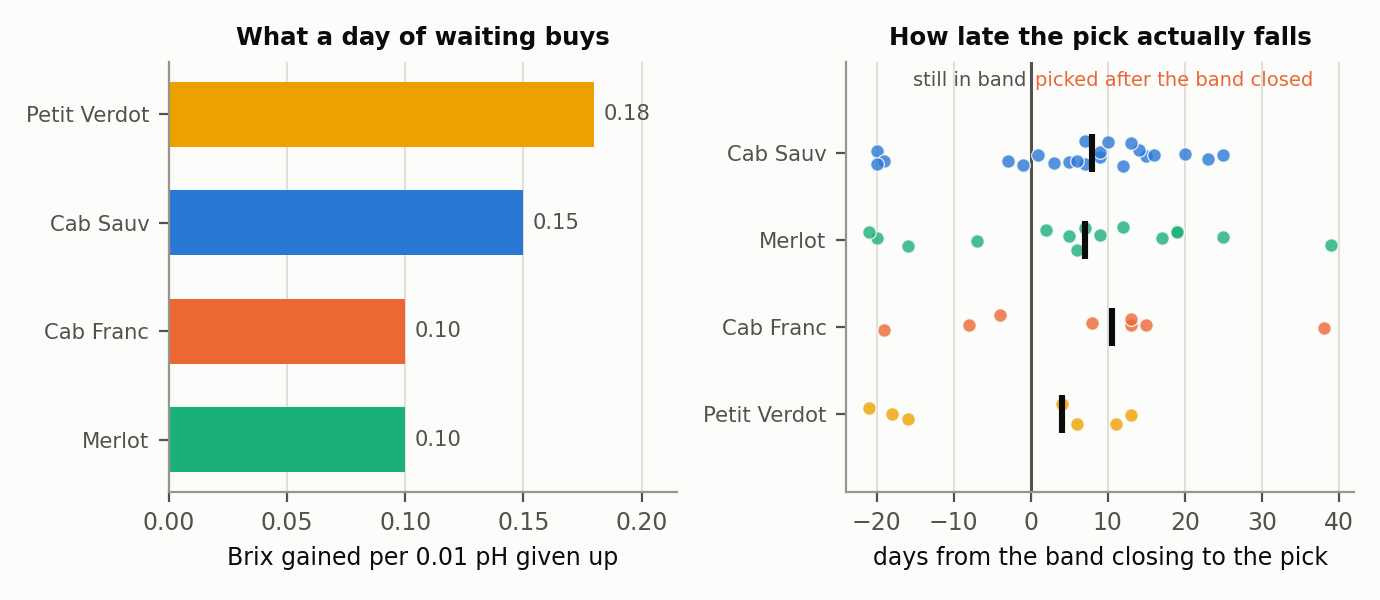
Figure 7. Left: the sugar gained for each 0.01 of pH given up, by varietal. Right: for every block-vintage in which the sugar band was reachable, the number of days between the fruit leaving that band and the pick being taken. The heavy tick is each varietal's median.
Waiting a day buys sugar and costs acid at a per-block rate: Petit Verdot gains 0.18 Brix for each 0.01 of pH, Cabernet Sauvignon 0.15, Cabernet Franc and Merlot 0.10. Merlot is the worst bargain on the property — the same day of waiting costs nearly twice the acid as Cabernet Sauvignon for similar sugar.
The right panel puts a size on the habit. Across the 52 block-vintages in which the sugar band was reachable at all, we picked a median of seven days after the fruit had already left it, and after the band closed in 37 of 52. At 0.15 Brix a day, that week was more than the whole width of the band.
4. Color is a plateau, not a limit
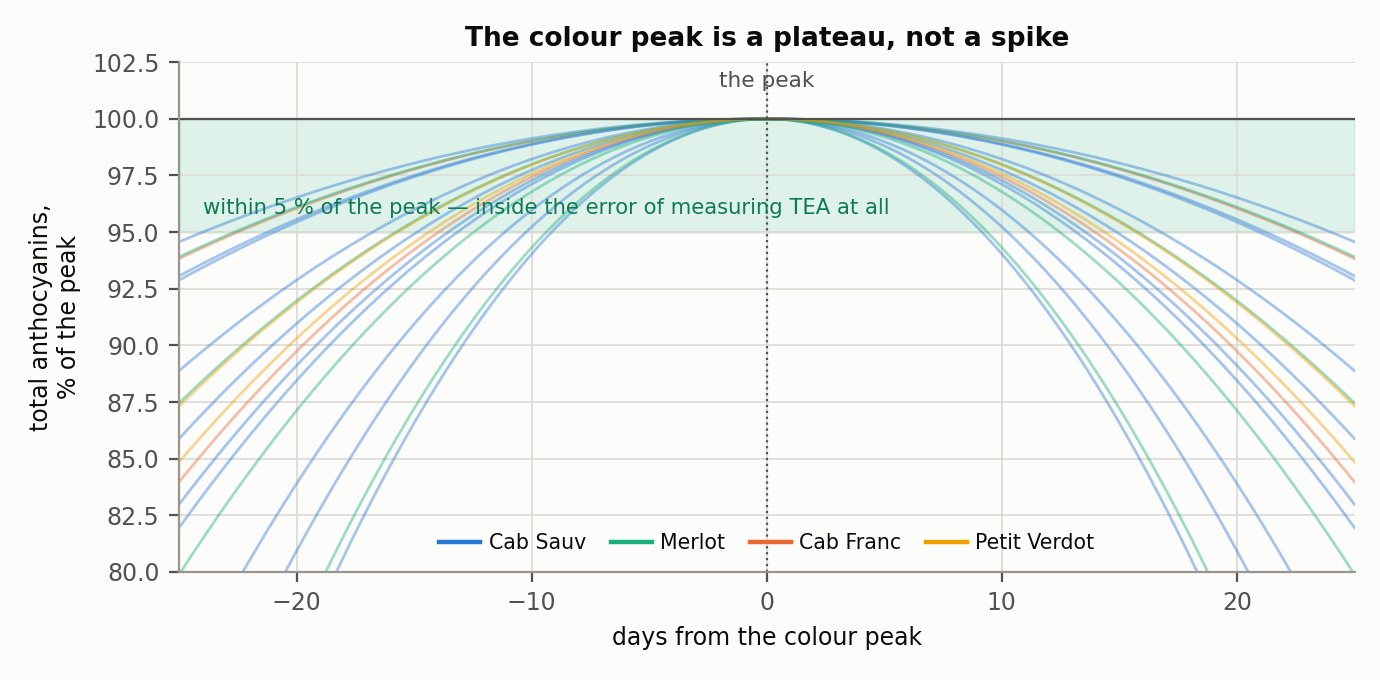
Figure 8. . Every anthocyanin trajectory with enough samples to fit, aligned on its own crest and expressed as a percentage of it. Every hill is the same 33 days wide, borrowed from the archive, so what differs between seasons is how deep the fall is. The band is 5 % of the crest — as wide as the scatter of samples about their own trajectory
Anthocyanins are estimated on spectral analysis, as discussed in a separate note.
Our goal is to maximize color, which we measure as the extractable anthocyanins. Our berry maturation model shows color rising to a crest and then falling, so the task is to predict when the crest arrives. The crest turns out to be surprisingly flat.
Anthocyanins fall by 1 % about six days either side of the crest, 2 % at eight days, and 5 % at thirteen. Samples scatter about their own fitted trajectory by 5.1 % of the crest — sampling and estimation together, measured inside our own chain — so a week either side of the crest is not a loss we could detect. The crest usually falls close in time to the point where the other targets are met or breached. So, in practice, the color target becomes the least important of the three: the cost of not picking at the exact crest is small compared with both the estimation error and the trade-offs in pH and Brix.
5. Berry sample measurements differ from measurements at the crush
Everything up to harvest is measured on hand-picked field samples of 100 berries each. At the crush, we get our first chance to measure the must's actual chemistry, and it is the only outside check the harvest model has. The result is surprising: across 62 matched picks, the crush reads +1.89 Brix and +0.27 pH higher, above the line in 87 and 97% of cases.
With a median of two days between the last sample and the pick, the difference is not ripening—two days of ripening is 0.26 Brix and 0.016 pH. We tested four explanations for the pH half, and three of them can be ruled out. The vine's own pH rise accounts for about 8 %: the berry series moves 0.0086 pH a day near harvest, against the 0.0039 a day our gap regression had been fitting, but at a two-day gap that is 0.017 of pH against a gap of 0.256. Dehydration, ripeness level and heat in the window explain nothing at all—correlations of +0.01, −0.08 and −0.15 against the residual gap. The per-block split is not a ripeness effect in disguise either: both groups sample at the same 22.3 Brix, and the Cabernet Sauvignon term survives adding sample Brix to the model. And the pH gap and the Brix gap correlate at only +0.25, so they are two mechanisms rather than one. What is left for the pH is handling—the destemmer and crush work the skins harder than the treatment in a hand sample and release potassium. What is left for the Brix is selection: three hand passes take the poorer bunches and berries out before the crusher, and none of them touches the sample. The harvest record measures all three passes separately, and it backs that up — the Brix gap grows with the fraction of the gross crop we removed (r = +0.42 over 62 block-vintages and twelve seasons, p = 0.0008), while the pH gap does not move with it at all (r = +0.13). Nothing in our record measures potassium on either side of the crush, and that is the one measurement that could settle it.
The Brix gap and the pH gap behave differently, and only the Brix gap is the same for all blocks.
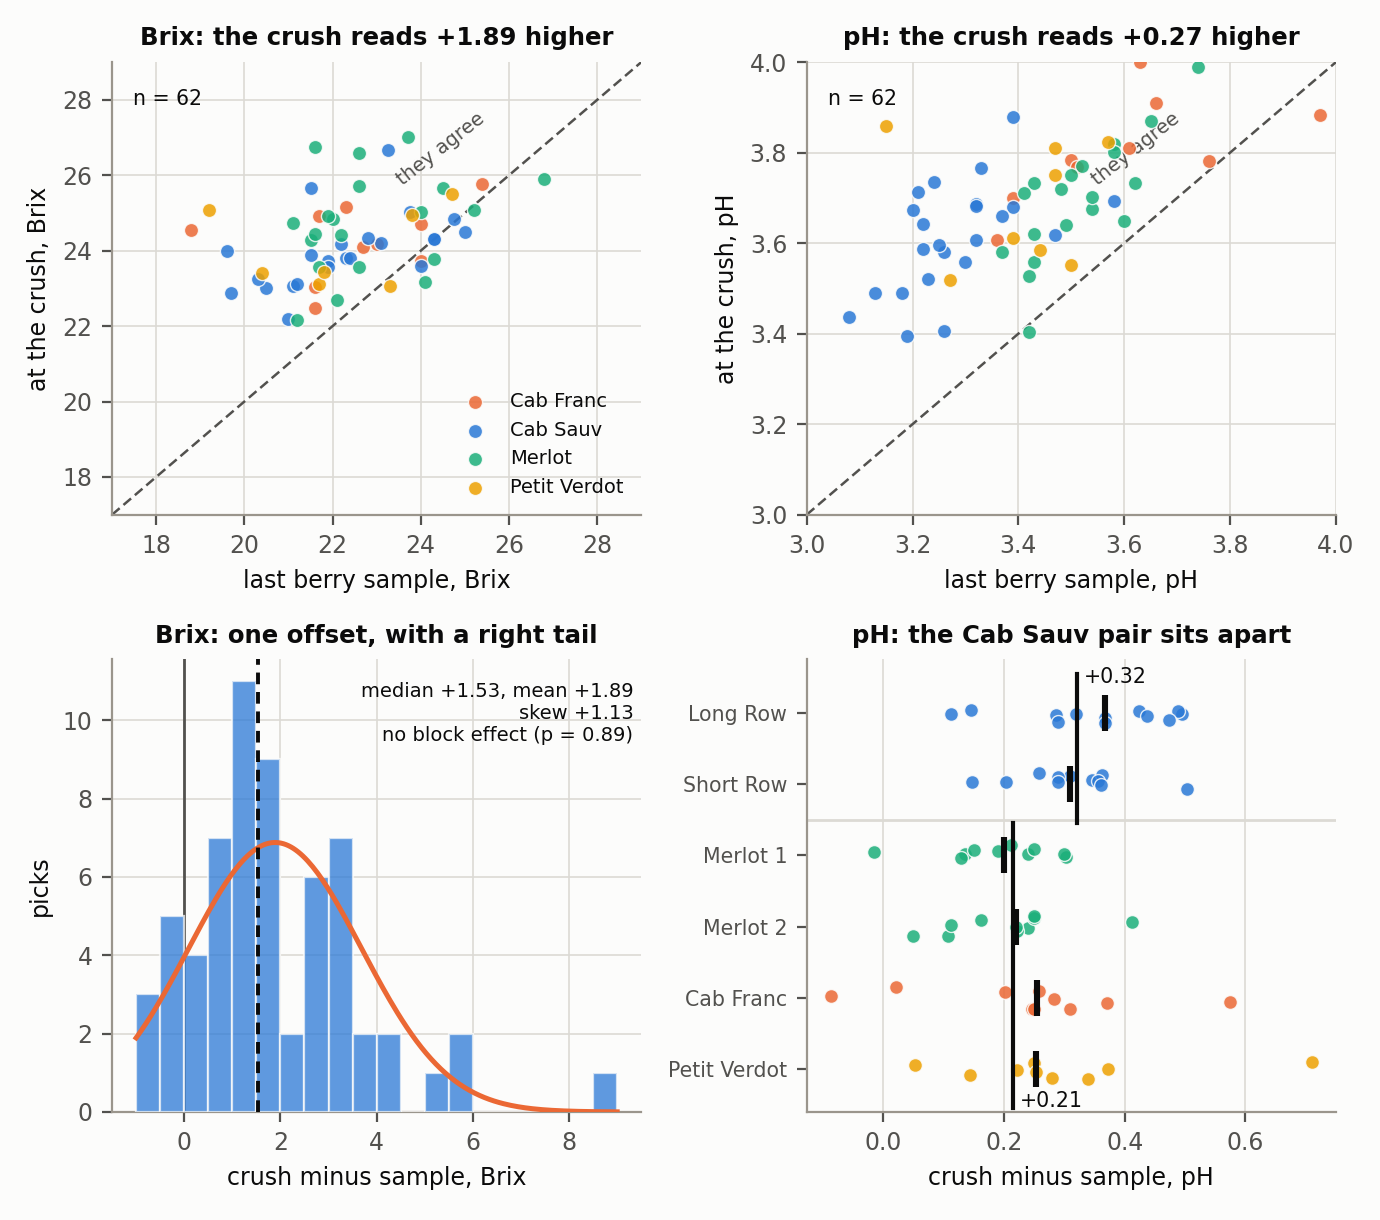
Figure 9. Top: the last berry sample before each pick against what the crush read, with the line of agreement. Bottom left: the Brix offset, one distribution for the whole property, with a long right tail. Bottom right: the pH offset block by block — the two Cabernet Sauvignon blocks sit about a tenth of a point above the other four, and the heavy vertical lines are the two values we use.
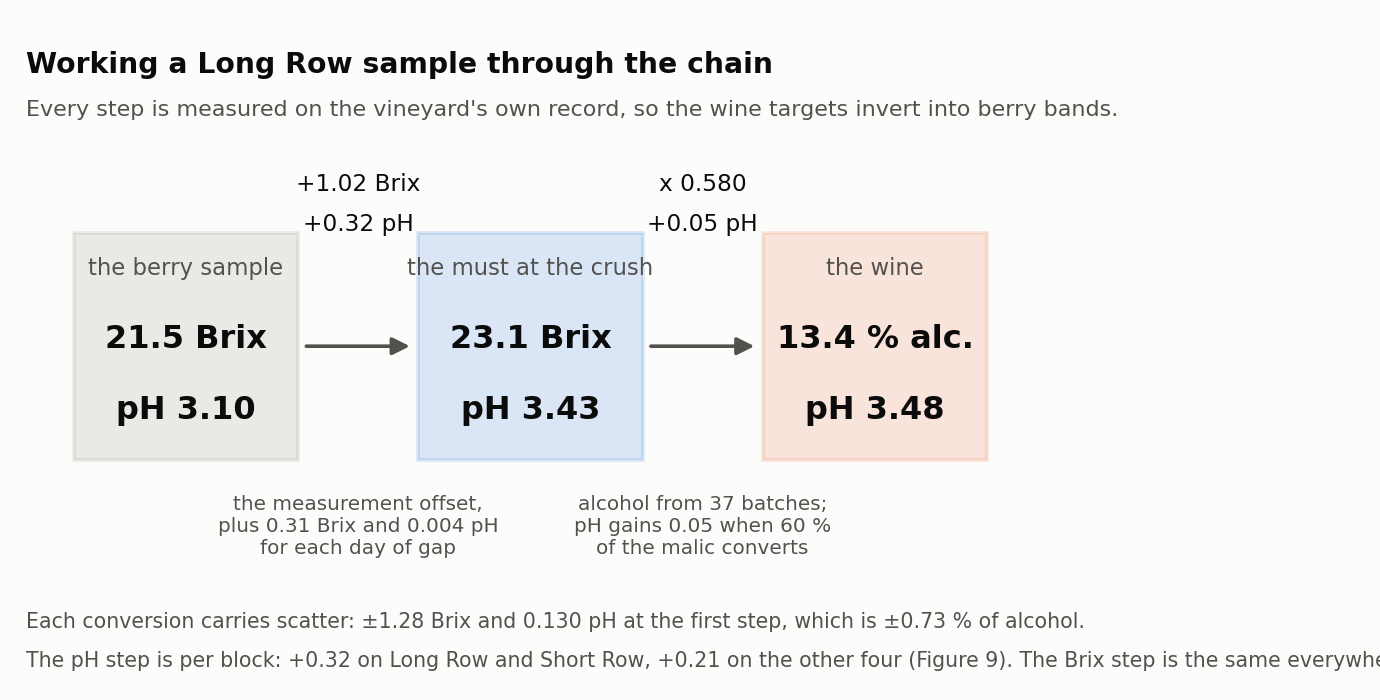
Figure 10. Working a Long Row sample through the chain. Each step is measured on our own record, which is what lets the wine targets invert into berry-sample bands. The pH step is the per-block one; the Brix step is the same on every block.
Sugar (Brix): one offset, and it is skewed. The distribution is not a clean bell. A handful of picks with very large gaps — the 2017 Merlot 2 batch that started at 26.7 Brix against a sample of 21.6 is the extreme — pull the mean to +1.89 while the median sits at +1.53, a difference of 0.2 % of alcohol. For a correction applied to a typical pick, the median is the better number.
Acidity (pH): two offsets, refitted by varietal. Long Row and Short Row gain about a tenth of a point more than the other four blocks on the way from sample to tank. Both levels are fitted on those pairs rather than carried over from the single constant they replace: +0.32 for the Cabernet Sauvignon pair, +0.22 for the other four, plus 0.004 per day of gap.
The change flows straight through to the berry bands the tracker draws, because they are derived by inverting this chain. Long Row and Short Row move from 3.04 – 3.24 to 2.97 – 3.17, and the other four from 3.19 – 3.39 to 3.23 – 3.43.
Bias-corrected, a berry sample predicts crush pH to about ±0.13 and crush Brix to ±1.28. The second is large: 1.28 Brix is 0.74 % of alcohol, against a target band 0.75 % wide.
The last step of the chain, must Brix to alcohol, carries an assumption. Over all 37 batches with both a starting Brix and a finished alcohol the ratio has a median of 0.567 and an sd of 0.023 — but that pools batches that fermented to dryness with batches that did not, and the two behave differently. How dry a ferment went is the strongest single thing that moves the ratio, and a cold soak adds to it. Restricted to batches that both had a cold soak and finished dry the ratio is 0.58, and that is the number this note and the cards use, under the assumption that the fermentation finishes dry. It is about 2 % above the pooled figure.
6. What the forecast is worth
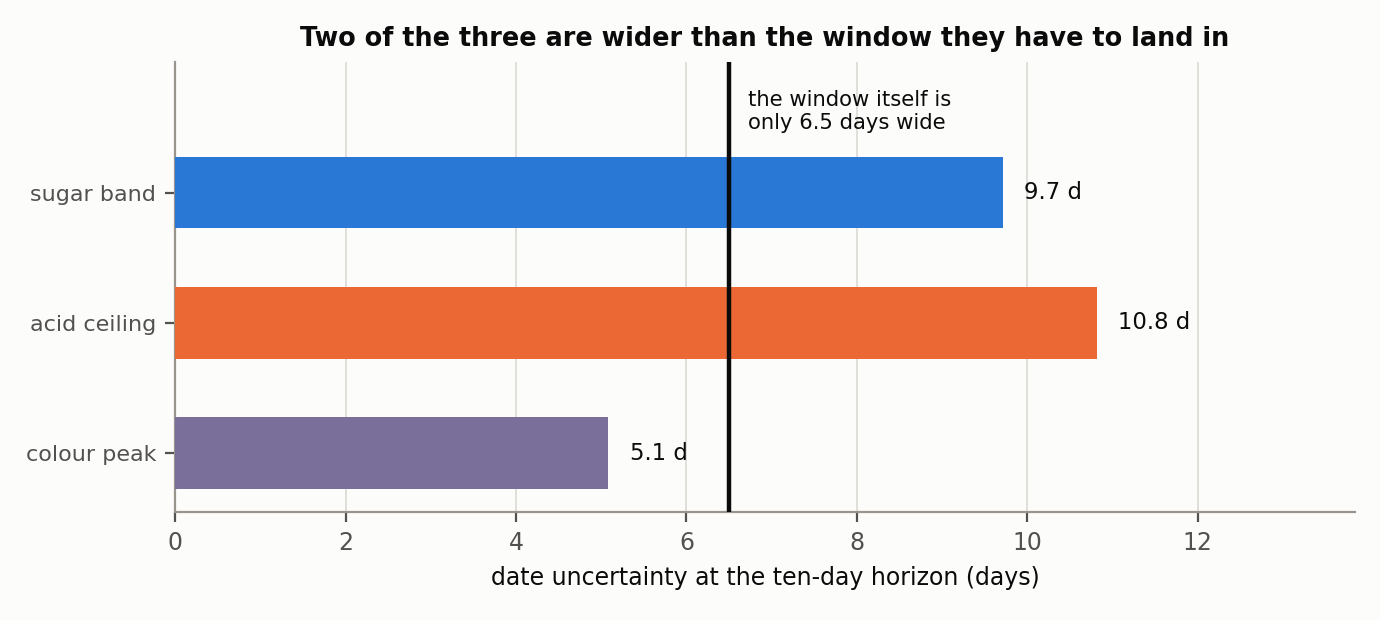
Figure 11. Each criterion's ten-day forecast error, converted into days of berry development. The vertical line is the median width of the window all three have to land in.
Sugar and acid project well. Over 242 leave-one-vintage-out forecasts the typical error is about 0.5 Brix at one week and 0.8 at three, and 0.03 to 0.06 in pH. Translating those errors into days of berry development over the forecast window is an eye-opener.
At the rates the fruit moves near the bands, the ten-day sugar forecast is worth about 9.7 days of date uncertainty and the acid forecast 11.1—against a median window of 7.0days. Both are wider than the window they have to hit, so the method narrows the decision from a month to a fortnight; it does not pick the day.
The color crest is the exception, and it runs opposite to what we assumed. It dates to 3.2 days—the only one of the three that fits inside the window. The criterion we treat as least important is the one we locate most precisely, because a crest is found from the shape of a whole season's trajectory rather than from a single projected value, and because the anthocyanin plateau is forgiving enough that being a few days out costs almost nothing. The two that drive the decision are the ones we can least afford to get wrong.
The horizon that matters is ten days. We berry-test on a Wednesday and always pick on a weekend. The first weekend that is feasible at a stretch is two or three days after the test; the first comfortable one is nine or ten. So the recommendation a card should be judged on is the one made about ten days out, with "one week earlier" as the standing alternative, and that is the horizon the back-test below uses.
How the back-test is built. For each block-vintage, we start at the nearest real berry test 10 days before the pick, project Brix and pH forward to the date the pick actually happened, run them through the same sample-to-must offset the cards use, and compare them with the must the crush recorded. Scoring the chemistry on the day we picked, rather than scoring the date, makes the comparison fair: until 2026 the targets were never written down, so a back-test that judged the recommended date against the date taken would measure a change of goal, not a forecast error. That change of goal is worth knowing too, so we measure it separately from the same anchor.
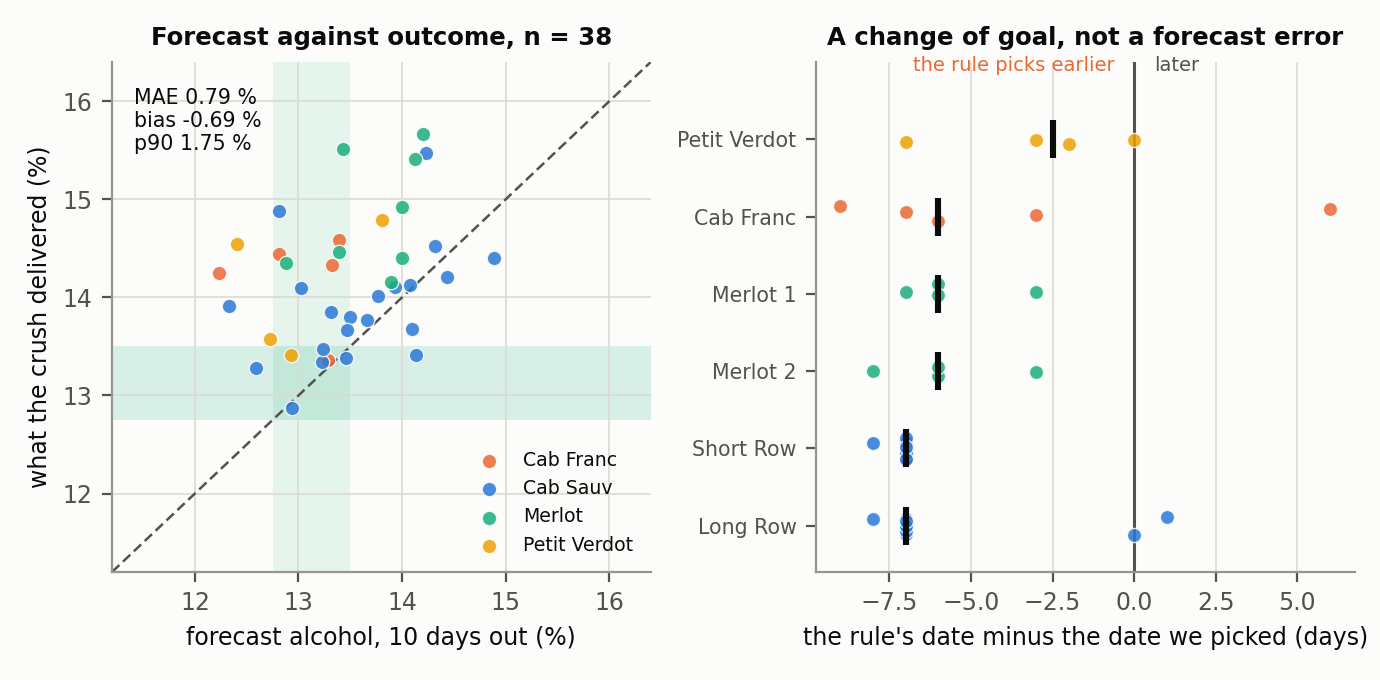
Figure 12. Left: the ten-day forecast against what the crush delivered, with the target band on both axes. Right: from the same anchor, the date today's rule would have named minus the date we actually picked — a different question, kept apart.
Over 38 block-vintages at a median horizon of ten days, and using the per-block pH offset of section 5, the forecast returns a must Brix mean absolute error of 1.35, a must pH error of 0.095, and an implied alcohol error of 0.79 % against a band 0.75 % wide, with a p90 of 1.63%. Where a color crest can be located from the anchor, it lands a mean of 3.2 days from the crest the full season shows,, on the thirteen block-vintages where the sampling caught one at both ends.
The other question gives a much cleaner answer. Today's rule would have named a date a median of seven days earlier than the one we picked, and earlier in 95% of cases. Long Row and Short Row are seven days early, Merlot 1, Merlot 2, and Cab Franc six. That is not an error. It is the size of the change in what we are aiming at, and it is the same week that section 3 found by a different route.
The Brix adjustment is still a mystery. The fruit came in above the forecast in 32 of 38 cases, with a Brix bias of −1.16, and nothing explains it yet. It is not a horizon effect — on the same cells, anchoring at seventeen days instead of ten gives −0.89 — and unlike pH it is not block-dependent either. It stays on the open list.
7. Where that error comes from
The error bar is about as wide as the target, so it is worth knowing which stage of the chain produces it. Splitting the variance needs one substitution and one independent estimate. Re-running the same conversion from the last real sample instead of the ten-day forecast isolates the projection cost. The 100-berry sampling noise is measured separately, from the scatter of readings about each block's own fitted curve. What remains is the conversion itself.
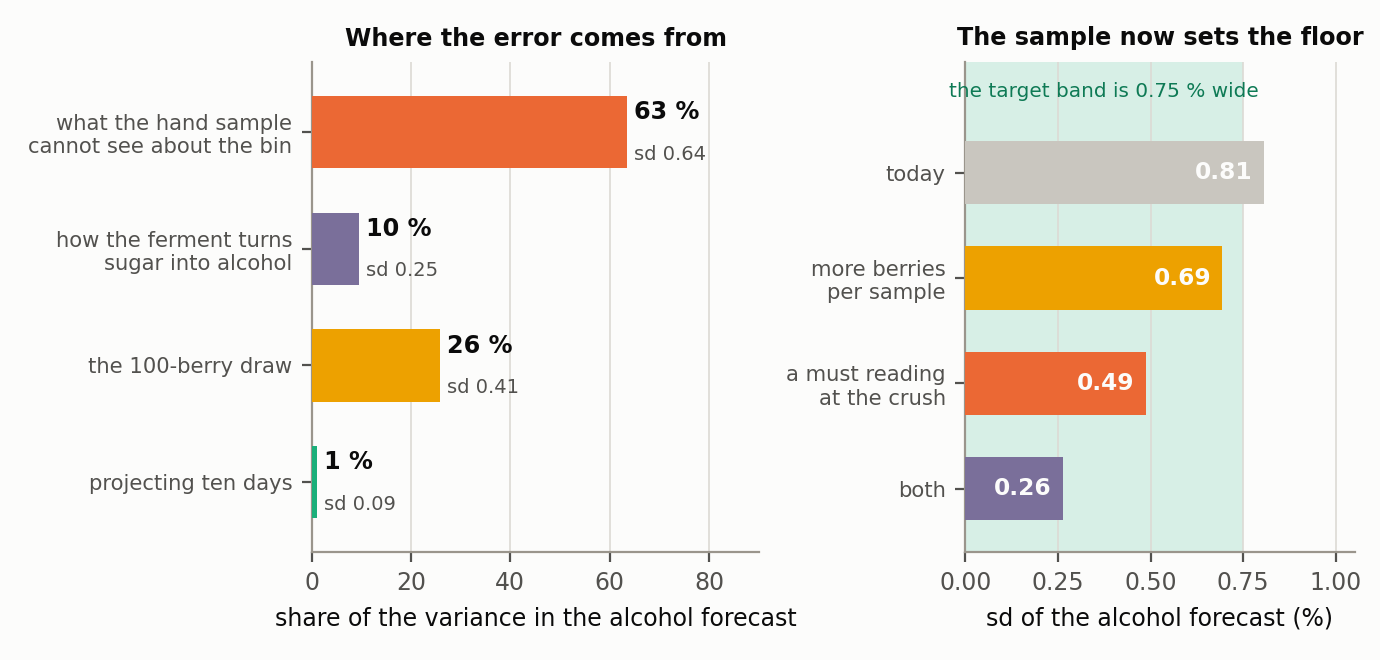
Figure 13. Left: the share of the variance in a card's alcohol figure contributed by each stage, with the ferment taken at its dry-finish value. Right: what the forecast's spread would be if each source were removed entirely, against the 0.75 % target band.
Projecting the fruit forward costs nothing at all — it pays. The berry model does not limit the decision. At a ten-day horizon the forecast is slightly tighter than today's real sample, by about 6 % of the variance: the trajectory averages out part of the 100-berry draw that a single reading carries, so projecting forward removes more noise than it adds. To narrow the band do not start with the model.
The largest contributor to the error in the alcohol forecast , the width of the bell-curve, comes from the difference between the alcohol equivalent of Brix in the sample and the alcohol equivalent of the measured brix at the beginning of the fermentation: What the hand sample cannot see about the fruit that reaches the bin is the largest single term, at 63 %, and it is the one section 5 already names. The 100-berry draw itself is 26%, and that’s the only part that larger samples could improve. The remaining 10% of the error comes from the fermentation.
One caution on that last term. The dry-finish sd rests on seven batches, so it is itself uncertain to about a third of its own size, and it holds only while every ferment cold-soaks and finishes dry. The first one that does not is back on the pooled figure, where the ferment is 34 % of the variance and the total spread 0.94 %. Both are in the budget file; the figure above draws the dry-finish split.
The fourth stage is not in the back-test at all. The published figure compares predicted must Brix with actual must Brix and then multiplies by the factor to speak in alcohol; that expresses a must error in alcohol units but says nothing about the spread of the conversion itself. How large that is depends on the assumption of section 5. Pooled over every batch on record, the factor's sd is 0.023, which at 24 Brix is 0.55% alcohol—but among the batches that finished dry, it is about half that, 0.25%.
So the assumption earns its keep twice. It raises the factor, which moves every alcohol figure up and the Brix band down. And it shrinks the last term of the budget: the total spread on a card's alcohol figure falls from 0.94 % to 0.80 %, and the amount by which the card understates its own error falls from roughly a quarter to about 5 %.
What remains is a simpler picture. 61 % of the variance is what the hand sample cannot see about the fruit that reaches the bin, the 100-berry draw is 30 %, and the ferment and the forecast together come to 10 %. The leverage is almost entirely in how the fruit is sampled — the one item on the list that no amount of modeling will touch.
8. Color extraction during fermentation reaches around 65% of potential
Our fermentation records track color extraction. Forty-nine batches over 2014–2025 clean data on color potential and maximum extracted.
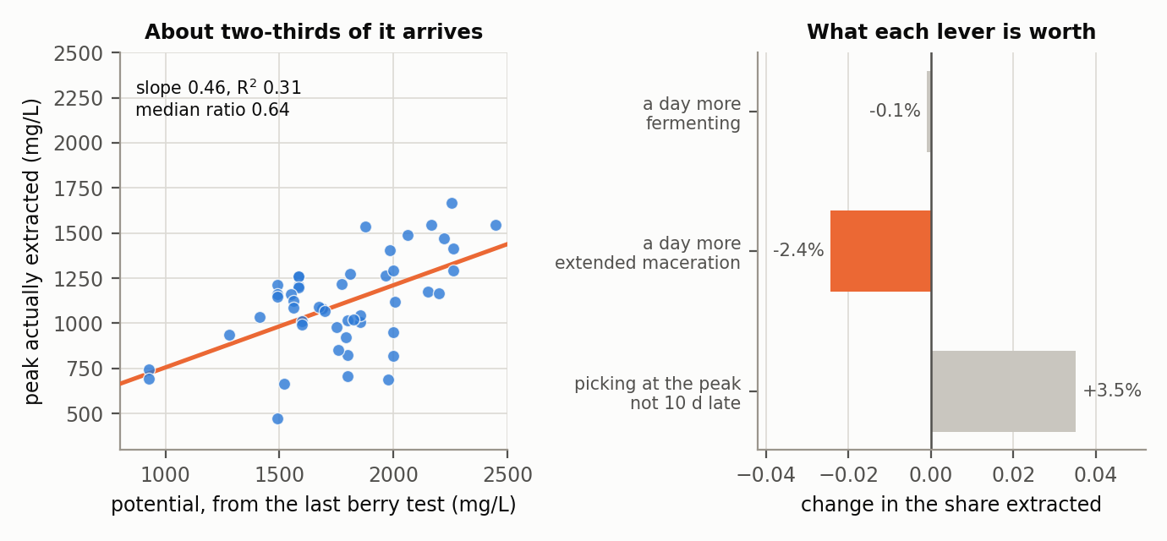
Figure 14. Left: what the fruit was estimated to hold against what the ferment pulled out, with the line of complete extraction. Right: the size of each lever, in share of potential anthocyanins.
The potential we measure in the berry does predict what we get out. Fruit estimated to hold more anthocyanins delivers more—the extracted peak rises 46 mg/L for every 100 mg/L of potential, r = 0.56. This is the first confirmation of the berry estimate against something outside itself.
But how much of it we actually extract varies far more than the potential does around its crest, and we do not yet understand why. A median of 0.64 of the potential arrives in the wine, ranging from 0.32 to 0.82, and 59 % of that variation is batch-to-batch within a single vintage. The only process term that survives vintage controls is extended maceration, at −2.4 % of potential per day, and it could as easily be a symptom as a cause. Against that spread, the 3- 4% of color at stake in picking at the crest rather than 10 days after, it is small.
Two conclusions follow. Fine-tuning the pick date around the color crest is not worth much. But knowing the size of the crest remains useful, because it is the input to the much larger lever — how the batch is fermented and cellared afterward.
9. Heat spikes
Whether heat should change the pick was put to the data at three thresholds, counting both plain day totals and consecutive runs
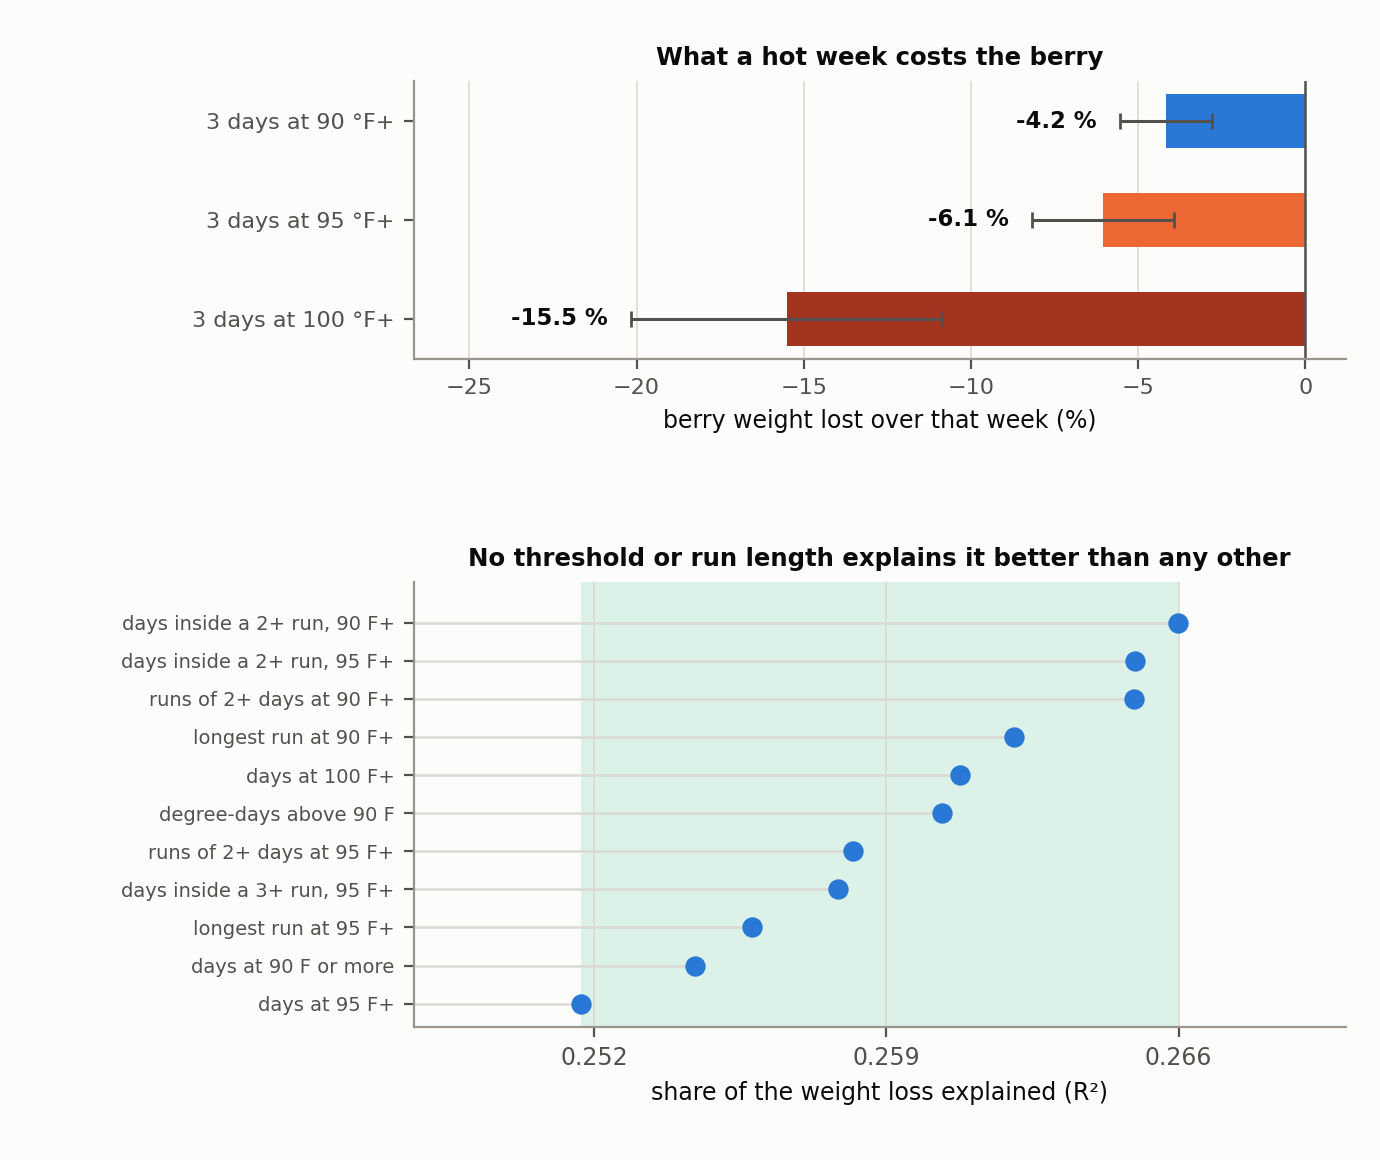
Figure 15. Top: what a week containing three hot days costs in berry weight, by threshold, with standard errors. Bottom: how well each of eleven definitions of a heat spike explains that weight loss — every one lands inside a band 0.014 wide.
On berry weight, the effect is large. Over 237 sampling intervals with starting Brix controlled, a week containing three days at 90 °F costs 4.2 % of berry weight; at 95 °F, 6.1; at 100 °F, 15.5.
No definition of a spike beats any other. Eleven of them (day counts at each threshold, degree-days above it, longest run, counts of two- and three-day runs, days sitting inside such runs) explain the same 25 to 27 % of the variance and correlate with one another above 0.9. Adding run structure to a plain day count buys nothing measurable. Every one is negatively signed, so clustered heat looks slightly worse than scattered, but only twenty intervals in the archive contain a two-day run at 95 °F and ten a three-day run: consistent in direction, unproven in size.
On color potential, nothing. Within block alone, every heat measure is mildly negative, the physiologically expected sign; held against block and season together, every one collapses to zero, and with 26 block-vintages the design can only see swings above about 170 mg/L.
Operationally, that combines into one rule. Heat does not measurably change what color the fruit can make, but it certainly dehydrates the berry, and dehydration raises Brix without adding sugar — the same term that appears in section 5's sample-to-crush gap at two and a half times the sugar-accumulation rate. A heat spike is a reason to distrust a Brix reading, not a reason to pick. With two-sided bands that matters more than it did, because a spike can walk the fruit into the band, and past it, without anything having really changed.
The Tracker Dashboard for decision support
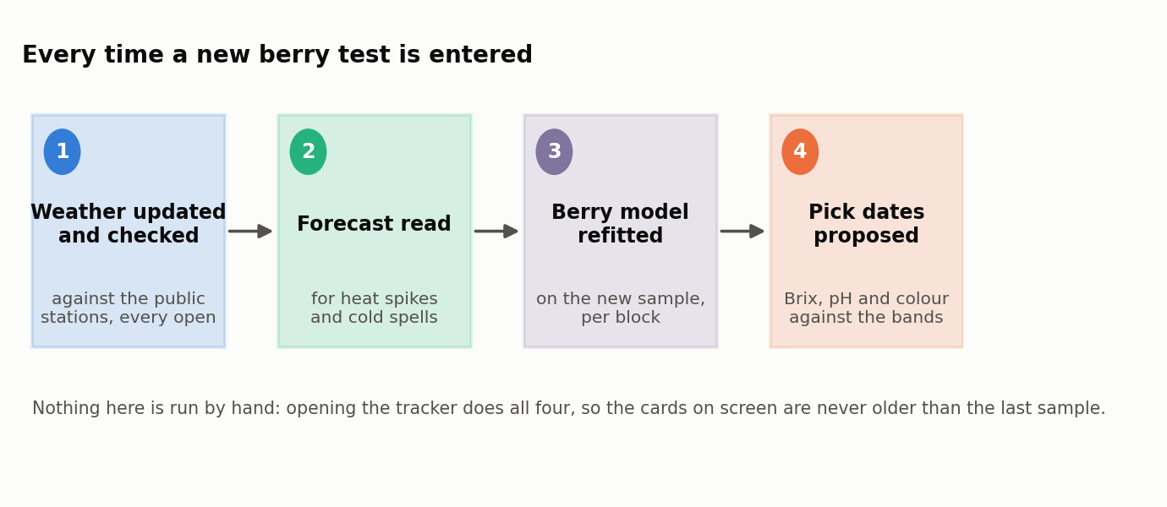
Figure 16. What happens when the tracker is opened after a new berry test is entered.
The purpose of this extensive analysis was to develop a decision-support tool. A real-time dashboard that
tracks and verifies the weather data from our weather stations
records the results from our berry tests and recalibrates the berry models
projects the chemical properties of the sampled vineyard blocks forward, and
proposes optimal picking dates for each block given our targets for wine characteristics
We still need to decide when to pick, but we have a better understanding of the trade-offs in reaching our clearly defined targets
Entering a berry test and opening the tracker triggers four things in order. The weather record is updated and quality-checked against the third-party stations. The forecast is read for heat spikes and cold spells — the first because a spike inflates a Brix reading without adding sugar. The berry model is refitted on the new sample, per block. And the model projects Brix, pH and anthocyanins forward, compares them against the target bands, and proposes an optimal pick date with alternatives either side.
The Tracker Dashboard contains a lot of current and historical information and forecasts
1. The Block Cards
The most important result is the six block cards, rebuilt every time new berry samples are entered. Each card gives a pick recommendation, or the pick results for one of the six blocks. The following picture shows two of the six cards. On the left the card for the Long Row Cabernet Sauvignon block, which needs to be picked shortly, on the right the card for the Cabernet Franc block which has already been picked
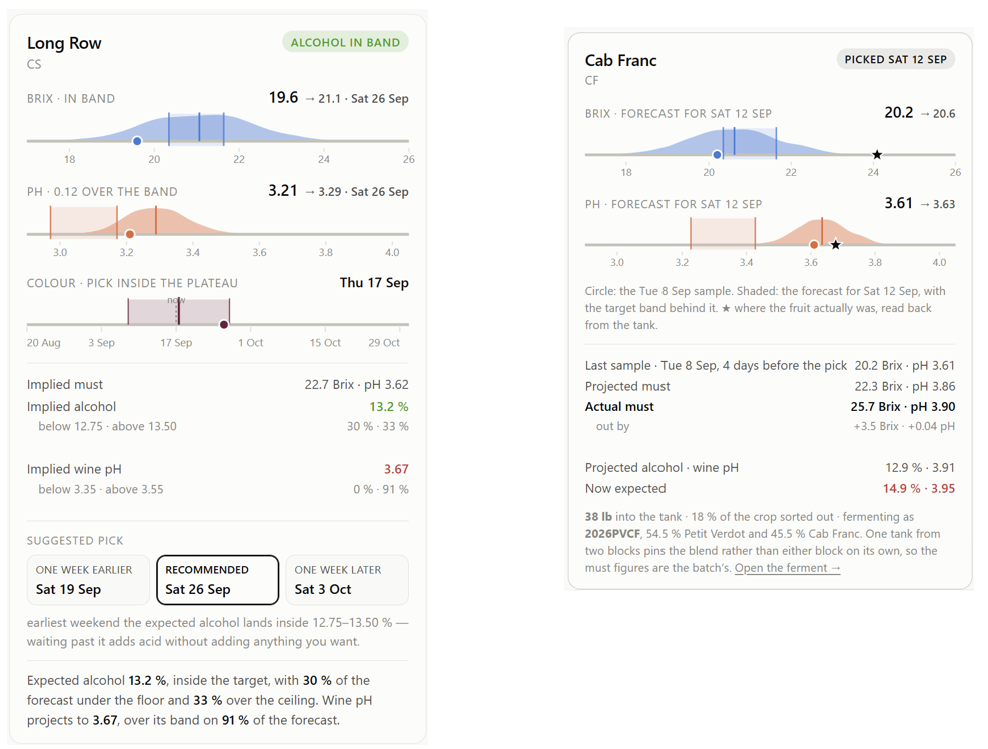
Figure 17. Two of the six block cards in the evening of September 16, 2026, with 6 rounds of samples in and a harvest 10 days away. Long Row is the ordinary case: for a harvest on September 26, the expected alcohol lands inside the target, and the acid to be well over its band. Cab Franc has already been picked — Brix came in 4 points (!) higher than expected while pH was above target as expected. We expect fermentation to finish at 14.9% alcohol and 3.95 pH
Each forward-looking card carries four things in the same order.
Where the fruit is and where it is going. The number on the left is the last berry sample; the shape is the forecast at the selected date — a distribution rather than an error bar, because what is forecast is the change from today, drawn from past moves of similar length at similar ripeness, and those lean upward the way fruit does. The shaded strip is the block's target band.
What that becomes in the tank and the bottle. The must runs about +1.6 Brix and +0.26 pH above the sample at a two-day gap; alcohol is must Brix × 0.58; wine pH adds 0.05 for malolactic. Under each figure is the chance of finishing under the floor and over the ceiling. Long Row reads "alcohol in band" in green at 13.2 %, but the green hides a split risk — 30 % of the forecast finishes under the floor and 33 % over the ceiling — and its wine pH clears its band on 91 % of draws. A single number would have shown none of that.
Three dates and the trade between them. The recommendation is the earliest weekend whose expected alcohol lands inside the band. Because acid only rises, that is also the lowest-pH date among those that qualify, so pH needs no rule of its own. Either flank is seven days away, and choosing one redraws the card at that date.
What the picture is for. The probability distributions highlight the range of possible outcomes within target ranges, given measurement and modeling errors, as well as weather and process variability.
Each backward-looking card shows what actually happened and what it means compared to the alcohol and pH goals set.
2. Weather Review
Here are the three most important charts in the Tracker:
The recent weather and near-tem forecast for temperature
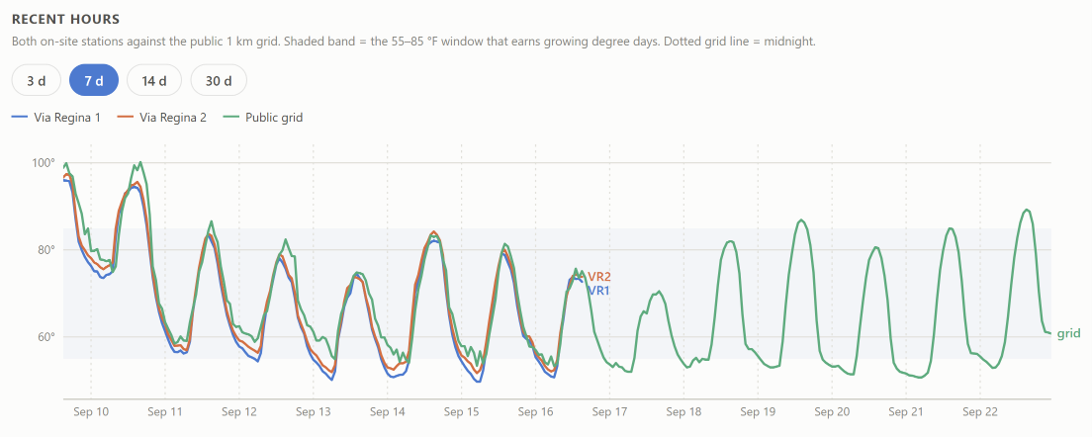
Figure 18: Weather forecast
How much did this year’s cumulative temperature and rain diverge from their average over the last 10 years?
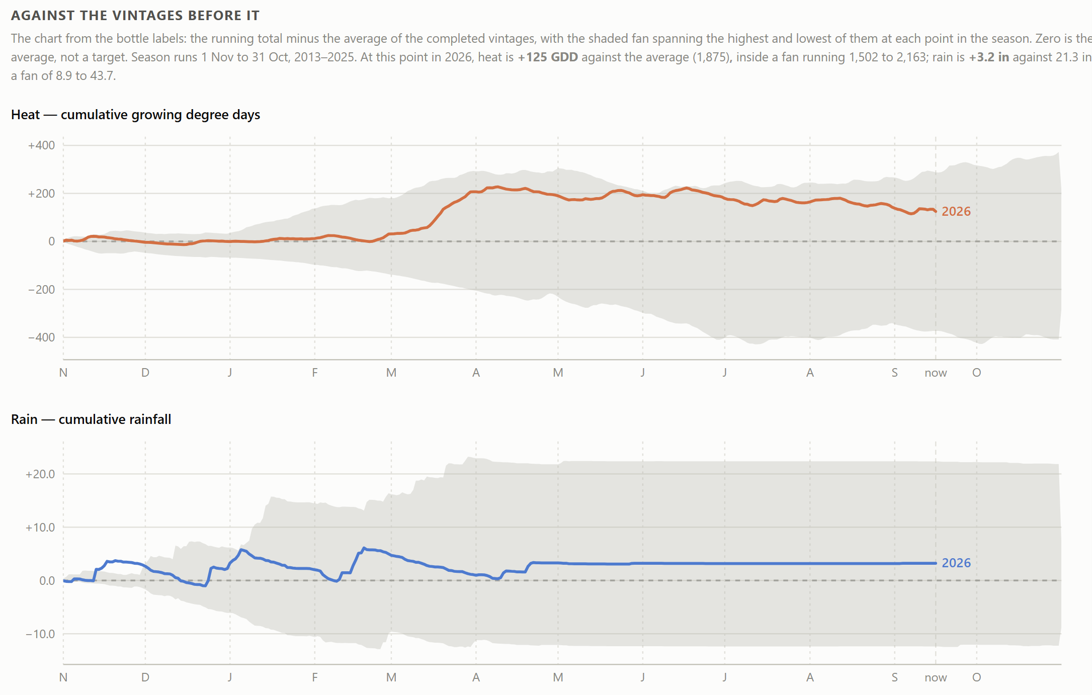
Figure 19: Cumulative heat and rain differences from average vintage
Most importantly, how confident are we that the current weather station data is reliable:
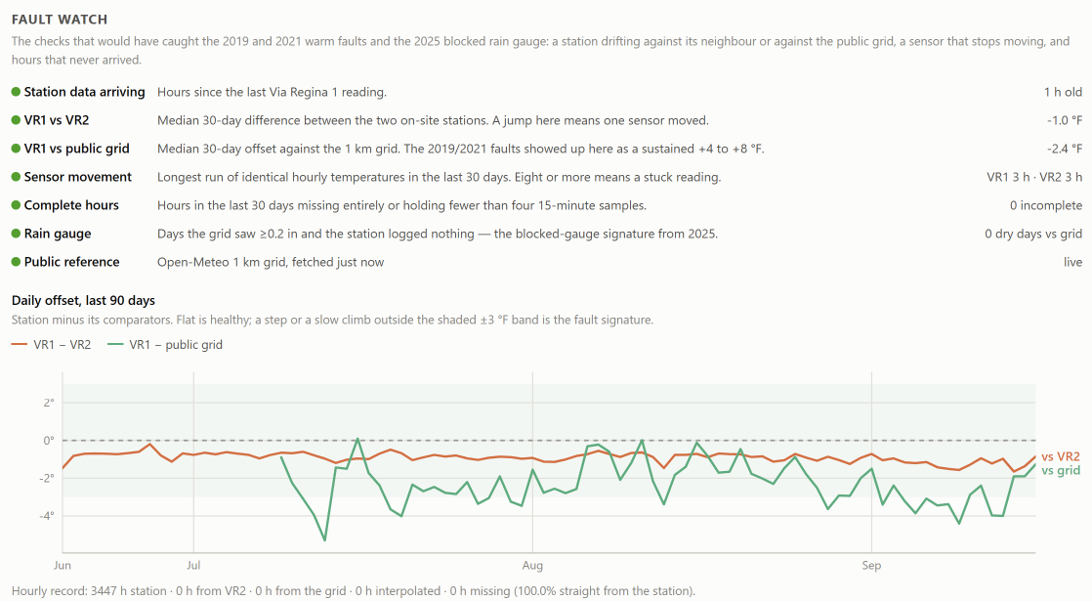
Figure 20: Weather data check
Prior Art
We checked twenty-one papers against the claims in this note. The full list, with what each one was checked against, what could and could not be confirmed, and a link to the source, is in Appendix: Papers checked for Prior Art.
Where Prior Art agrees. Casciato and Keller (AJEV 2025) is the closest match to our section 9: sugar import into the berry stops at about 23 Brix, after which Brix keeps climbing while the berries lose 6 to 15 % of their weight and their pH rises. That is our dehydration finding, arrived at independently, and it adds something we had not priced—the late Brix rise is paid for in yield. Fournand and colleagues (2006) support the color plateau: anthocyanins accumulate to about 170 g/L of sugar in the pulp before “undergoing a slight decrease,” and extractability shows no trend at all from 162 to 275 g/L, so phenolic ripeness is not a moving target across any plausible pick window. On the pH side of section 5, Hendrickson and Oberholster (2017) report that machine-harvested musts read higher pH than hand-picked due to greater skin maceration, and that successive optical sorting raises both Brix and pH.
On sampling, the numbers are better than we assumed. Travanic-Fuentes and colleagues (2024) measured coefficients of variation in Cabernet Sauvignon of 6.7 to 11% for soluble solids and 24 to 33% for berry weight. The paper does not say in so many words whether those are computed berry-to-berry or across its 50-berry replicates, but the berry-weight figure settles it: a spread of 30 % is what single berries do, and averaging fifty of them would leave about 4 %. So, these are berry-to-berry numbers. At 24 Brix a 6.7 % spread is 1.6 Brix between berries, which puts about 0.16 Brix of standard error on the mean of a hundred of them. We measure the noise on one of our own 100-berry samples at 0.69 Brix—four times that, and enough to imply a berry-to-berry spread near 29 % if the draw were all there was to it. It is not: on these figures the random draw accounts for something like a twentieth of the variance we charge to it, and the rest is where in the block the hundred berries come from. Meyers and colleagues (2011) found maturity autocorrelated at the vine-spacing interval and cut sampling requirements by up to 60 % by exploiting it. That is the cheaper lever, and we are not pulling it.
Where Prior Art disagrees: Three places, and they are important.
Heat and color. Our section 9 finds that heat moves berry weight but not color potential. Gouot and colleagues (2019) report that “a decrease in total anthocyanins is reported in most cases” under high temperature, so ours is the minority position. Two things keep it defensible. The experimental work that finds large losses uses sustained chamber heat—Mori and colleagues (2007) held vines at 35 °C and lost more than half the anthocyanins—which is not a two-day field spike. And most of that work reports concentration, while we measure content per berry; under dehydration, the two move in opposite directions. The one study titled for our exact finding, Sadras and Moran (2012) on elevated temperature decoupling anthocyanins from sugars, we could verify only by title.
The anthocyanin peak. Bindon and colleagues (2013) harvested Cabernet Sauvignon across 20 to 26 Brix and saw anthocyanins rise monotonically—no crest at all. They report concentration rather than content per berry, and their range runs well into the dehydration phase, so the reconciliation is the one section 9 already supplies: a berry losing water concentrates what it holds. Our crestis in content; theirs is in concentration. Both can be right.
The Brix half of section 5. We had assumed the crush reads higher partly because it works the fruit harder. For sugar, the literature says otherwise: Dumas and colleagues (2020) tested six extraction methods and found “sugar concentrations of the must were not modified by the extraction method,” while potassium was the most sensitive parameter of all. That points the Brix gap away from extraction and toward selection — is the fruit that reaches the tank different than the fruit in the sample bag? Ours passes three hand-selection steps the sample never sees: pickers drop bunches they don’t like and cut out the bad sections; a second crew re-sorts the bunches; and after the destemmer, another group remove everything but grapes before the clean berries fall into the crusher. No pumps, and every pass removes the less ripe material. The harvest record agrees, and it weighs each pass separately: what the pickers leave on the vine, what the second crew takes off the table, what the destemmer loses, and what comes off the vibrating table, with juice loss kept apart from all of them. Across 62 block-vintages and twelve seasons the Brix gap grows with the fraction of the gross crop those passes removed, r = +0.42 (p = 0.0008), and the correlation stays between +0.36 and +0.50 whichever single season is left out. The heavily sorted half averages +2.61 Brix against +1.17 for the lightly sorted half; with block and gap days controlled and errors clustered by season, ten points more sorting is worth +0.83 Brix (t +4.4). The field drop and the crush-pad passes each survive the other, sorting does not predict the gap in days — which it should not — and it does not move the pH gap (r = +0.13), so the two halves of section 5 stay independent. Hendrickson and Oberholster (2017) is the nearest published support: successive optical sorting raised both Brix and pH. Kasimatis and Vilas (1985), whose berry samples ran higher in Brix than cluster samples, compares two ways of sampling a field rather than a sample against its own must, so it does not bear on ours.
What nobody has published. The comparison in section 5 itself. We found no study that pairs a field sample against the must from the same fruit and quantifies the offset. The mechanism papers exist, and two of the three found their effects small or not significant. So, our +1.53 Brix and our +0.22 and +0.32 pH are, as far as we can tell, new numbers rather than confirmation of anyone else’s.
A comparison that is not one. One of our companion note on estimating phenolics from spectra reports anthocyanin estimates at R² around 0.90 to 0.96, and the published range for spectral anthocyanin calibrations, collected by Cozzolino (2015), runs 0.65 to 0.90. It would be easy to read ours as better. It is not the same measurement. Published models are scored against a wet-chemistry reference—HPLC or a laboratory assay—while ours is scored against the WineXray reading, and WineXray is itself a spectral estimate. Ours is the second stage of a two-stage chain, so it measures how well we reproduce the WineXray algorithm, not how close either of us is to the true phenolic content. End to end, spectrum to wet chemistry, our number is certainly below the stage-two figure and is not comparable to the literature’s. Janik and colleagues (2007) add the practical caveat: a grape anthocyanin calibration that reports 0.9 in-sample degrades on a new season and needs recalibrating, which is the failure mode to watch for rather than the headline R².
One claim we make that the literature does not. Measured wine alcohol has risen over recent decades—Alston and colleagues (2015) document it on international data—and later picking for flavor is among the explanations offered. But we found no published work showing that growers pick later than their own optimum. Our finding of picking late is against a target we set ourselves and wrote down only in 2026, which is a narrower claim.
Sources
The spectral models behind the anthocyanin estimates are described in the companion note on estimating phenolics from spectra; the fruit's own development is the subject of Modeling Berry Maturation.
External sources: UC IPM's grape powdery mildew guidelines and the UC Davis (Gubler–Thomas) risk index; UC ANR on ontogenic resistance and the 12 °Brix marker; Winkler and Amerine (1944) for the degree-day convention we depart from; Baskerville and Emin (1969) for the sine approximations tested against the hourly integral; NOAA NCEI and CoCoRaHS for the reference network; Open-Meteo for the public grid the fault watch compares against.
Appendix: Papers checked for Prior Art
Twenty-one items, searched and checked through September 2026. Each entry ends with what was actually retrieved, followed by a link to the source. Nothing marked as unretrievable is quoted for a number anywhere in this note.
Sugar against dehydration — the paper closest to our section 9.
1. Casciato & Keller (2025), Am J Enol Vitic 76(2):0760019. Cabernet Sauvignon, Merlot and Syrah in warm arid Washington: sugar import stops at about 23 Brix, after which Brix keeps climbing while the berry loses 6 to 15 % of its weight and its pH rises. Supports our section 9 directly, and prices the late Brix rise in yield. Full text. doi.org/10.5344/ajev.2025.24069
2. Coombe & McCarthy (2000), Aust J Grape Wine Res 6(2):131–135. "Sugar and water increments after veraison are linked and depend on the same source, namely, phloem sap." The standard citation for sugar per berry as the ripening measure. Abstract. doi.org/10.1111/j.1755-0238.2000.tb00171.x
3. Rogiers and colleagues (2006), Am J Enol Vitic 57(1):73–80. Late-ripening shrinkage follows decreased phloem flow into the berry. Agrees with our reading of the bend. Abstract. doi.org/10.5344/ajev.2006.57.1.73
4. McCarthy (1999), Aust J Grape Wine Res 5(1):10–16. Weight loss from ripening Shiraz berries. Metadata only — the abstract is elided by the publisher, so no weight-loss figure is taken from it; Casciato & Keller supplies that instead. doi.org/10.1111/j.1755-0238.1999.tb00145.x
What limits a 100-berry sample (section 5).
5. Kasimatis & Vilas (1985), Am J Enol Vitic 36(3):207–213. The canonical treatment of sample size: two 10-cluster samples match two 50-berry samples for detecting a 1.0 Brix treatment difference. Framed as a treatment difference rather than a confidence interval on one block, so it does not translate directly. Abstract. doi.org/10.5344/ajev.1985.36.3.207
6. Rankine, Cellier & Boehm (1962), Am J Enol Vitic 13(2):58–72. Between-vine variation exceeds between-cluster; standard error of mean sugar was ±0.25 % for 25 vines at one cluster each. Also flags a bias: equal clusters per vine gives a biased estimate, because sugar is inversely correlated with vine yield. Abstract. doi.org/10.5344/ajev.1962.13.2.58
7. Travanic-Fuentes, Gutiérrez-Gamboa & Moreno-Simunovic (2024), Plants 13(18):2617. Cabernet Sauvignon soluble-solids coefficient of variation 6.71 % between berries, berry-weight 24 to 33 %. The cleanest input for deriving our own sample size — 6.7 % of 24 Brix is about 0.17 Brix of standard error on a 100-berry mean, which says our sampling term is not the draw size. Full text. doi.org/10.3390/plants13182617
8. Bigard and colleagues (2019), OENO One 53(1):267–287. Within one population in early August, sugar ranged from 500 to 1200 mmol/L between berries. The cultivar is a disease-resistant hybrid, so the magnitude is not a V. vinifera number. Full text. doi.org/10.20870/oeno-one.2019.53.1.2330
9. Meyers and colleagues (2011), Aust J Grape Wine Res 17(3):306–315. Autocorrelation at the vine-spacing interval; optimized sampling cut cluster requirements by as much as 60 %. Adjacent to our problem, and arguably the more actionable lever: where to sample, not how many. Abstract. doi.org/10.1111/j.1755-0238.2011.00152.x
The sample-to-crush gap (section 5).
10. Dumas and colleagues (2020), Vitis 59(2):77–83. Six juice-extraction devices: sugar was not modified by the method; pH and titratable acidity varied slightly, and potassium was the most sensitive parameter. Full text. doi.org/10.5073/vitis.2020.59.77-83
11. Shanshiashvili and colleagues (2025), Beverages 11(1):23. Comparable sugar, pH and titratable acidity whichever pressing method was used; the juicer’s slightly higher pH is attributed to skin fragmentation. Cited for the mechanism, not the magnitude — the differences were not significant. Full text. doi.org/10.3390/beverages11010023
12. Hendrickson & Oberholster (2017), Catalyst 1(1 Suppl 1):21–26. Machine-harvested musts read higher pH than hand-picked, from greater skin maceration; Brix and pH both rose with successive sorting levels. This is the half of our hypothesis the literature does support — selection, not handling. Full text. doi.org/10.5344/catalyst.2016.16004
13. Harbertson & Harwood (2009), Am J Enol Vitic 60(1):43–49. Contrary: skins adsorbed potassium during maceration rather than releasing it. It concerns fermentation rather than the crush, so it does not refute the mechanism, but it belongs on the record. Abstract. doi.org/10.5344/ajev.2009.60.1.43
The anthocyanin crest, the plateau and heat (sections 4 and 9).
14. Fournand and colleagues (2006), J Agric Food Chem 54(19):7331–7338. Our best support: free anthocyanins accumulated until 170 g/L of sugar in the pulp before a slight decrease, and extraction yields showed no clear evolution from 162.6 to 275.0 g/L. A flat maximum, and a second argument that phenolic ripeness is not a moving target across the pick window. Full text. doi.org/10.1021/jf061467h
15. Bindon and colleagues (2013), Food Chemistry 138(2–3):1696–1705. Contrary: across 20 to 26 Brix, grape anthocyanin and skin tannin concentration increased. Reports concentration rather than content per berry, so dehydration is confounded — which is the distinction section 9 rests on. Full text; a published erratum exists and was not retrieved. doi.org/10.1016/j.foodchem.2012.09.146
16. Gouot and colleagues (2019), J Exp Bot 70(2):397–423. Contrary: a decrease in total anthocyanins is reported in most cases under high temperature. Summarizes modest warming in Shiraz and Cabernet Franc as no difference at harvest but a delayed onset of accumulation. Full text. doi.org/10.1093/jxb/ery392
17. Mori and colleagues (2007), J Exp Bot 58(8):1935–1945. At 35 °C total anthocyanin content fell to less than half that at 25 °C, by degradation rather than reduced synthesis. Chamber conditions well beyond a field spike; treat as an upper bound. Full text. doi.org/10.1093/jxb/erm055
18. Sadras & Moran (2012), Aust J Grape Wine Res 18(2):115–122. Elevated temperature decouples anthocyanins and sugars in Shiraz and Cabernet Franc — the title is our claim. Citation verified, abstract not retrievable; no number is attributed to it. doi.org/10.1111/j.1755-0238.2012.00180.x
Rising alcohol (section 1).
19. Alston and colleagues (2015), Journal of Wine Economics 10(3):275–313. Measured alcohol has risen; the authors name producer response to flavor preferences, possibly alongside a changing climate. Establishes the outcome, not that growers pick later than their own optimum. Full text. doi.org/10.1017/jwe.2015.33
Spectral estimation (the companion note).
20. Cozzolino (2015), Molecules 20(1):726–737. Published anthocyanin calibrations at R² 0.65 to 0.90. Our own figures sit at or above the top of that range, which is why the range is quoted alongside them rather than the headline alone. Full text. doi.org/10.3390/molecules20010726
21. Janik and colleagues (2007), Analytica Chimica Acta 594(1):107–118. Partial least squares showed regression non-linearity and prediction bias, and needed seasonal recalibration. More useful to us than any single R²: a calibration reporting 0.9 in-sample degrades on a new season. Full text; the R² and RMSEP values were not retrievable. doi.org/10.1016/j.aca.2007.05.019
Searched for and not found. A paired field-sample-against-must comparison quantifying a Brix or pH offset — our +1.89 Brix is a novel observation rather than a confirmation. A peer-reviewed demonstration that growers pick systematically later than their own optimum. And a definitive sample size for a target Brix precision: Kasimatis gives a treatment-difference equivalence, Rankine a standard error for one design, Bigard asserts hundreds of berries without derivation, so the number has to be derived from item 7’s coefficients of variation.
draft 13, October 1, 2026
Here is the pdf file of this section 2016-10-01 Weather and Vineyard Actions.pdf