Modeling Berry Maturation
This note describes the models we use to turn fifteen years of weekly berry samples into a small set of numbers we can compare across our six vineyard blocks and seasons. It covers the vine's calendar, what we measure, the trajectories we fit to each measured quantity, and what those trajectories can tell us. When to pick is not in this note; that decision, and the weather and vineyard operations around it, are the subject of a companion note.
The note is structured as follows:
What we measure and the clock we use: What Quantities We Measure and How: the four things a berry does between veraison and harvest, what we measure of them, and how a sample is worked up. The Right Clock: why every date here is counted from mid-veraison rather than from the calendar or from the pick.
Trajectories to summarize observations: Four Types of Trajectories: the four shapes that cover every quantity we measure, and what decides which shape a quantity gets. Alignment: how a trajectory makes samples taken on different days comparable, and the one day we read them all at. Shape from History, Shift from This Season: the method — the shape of a trajectory comes from the archive, and only its position is fitted to the season in hand. A Season's Fingerprint: one block-vintage with all seven trajectories drawn, and how well each one fits.
Bends and Crests: The Bend: five measurements turn within days of each other, so there is one bend date per block-vintage rather than five. The Bend Is the End of Inflow: what the bend is physically, and why late Brix is mostly water leaving rather than sugar arriving. Color: the one quantity that crests before the pick, and how well we can date that crest.
Evaluation: What the Models are Worth: what each model buys against the alternative of assuming nothing changes. What We Have Learned, and What We Have Not: the findings, and the four claims the data does not support.
Prior Art: Prior Art: where published work agrees with what we found, where it disagrees, and where it is silent. Appendix I: the twenty-two papers checked, with what could and could not be verified.
Leading up to Maturation: Appendix II: the season before the berries — budbreak, flowering and veraison, and the heat that sets them.
One important purpose of the model is to predict, a few weeks before the estimated harvest date, how the berries in each vineyard block will evolve until harvest. This prediction is essential for picking the best harvest day for each block. A separate note, Weather & Vineyard Actions (link) covers the implementation.
What Quantities We Measure and How
A berry between veraison and harvest is doing four things at once. Sugar arrives from the vine. Malic acid is burned off, reducing titratable acidity and letting pH climb. Color — the phenolic compounds — builds in the skin and the seeds. And the berry itself grows until, at some point, it stops being fed and begins to dry.
Each of those leaves a trail of measurements, and trails of measurements are hard to compare: two blocks sampled on different days in different years cannot be set side by side. So we complement each trail with a trajectory—a curve through the points, defined by three or four parameters. One trajectory approximates the series of individual observations for one quantity (e.g. pH), in one block (e.g. LFLR), in one vintage (e.g. 2025). The set of trajectories for all quantities is what we call the model, and it tells us how fast each quantity is changing and where it changes direction.
A sample is a hundred berries picked at random across a row in a block.
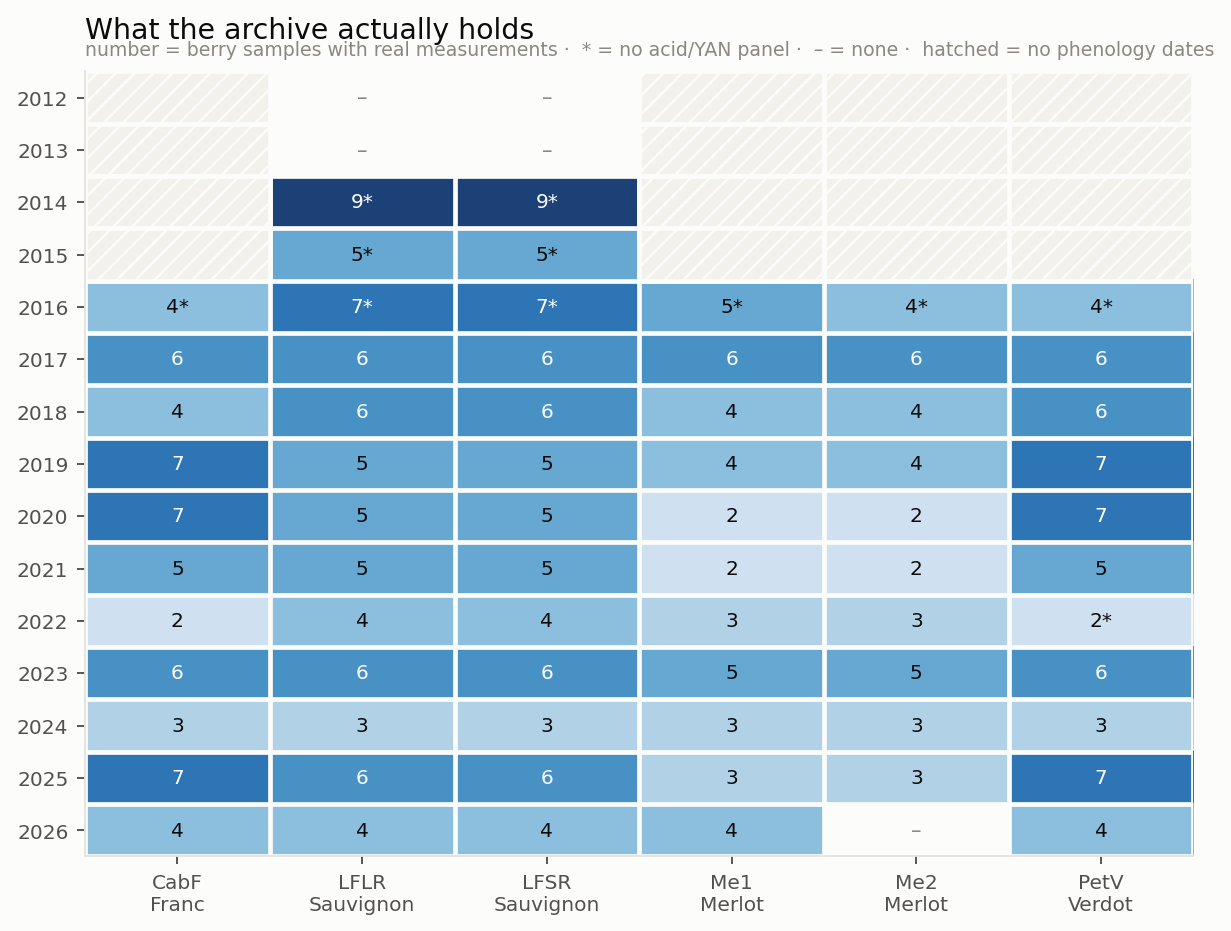
Figure 1. What the archive holds. The number in each cell is berry samples with real measurements. Hatched cells have no phenology dates; asterisks mark cells with no acid or nitrogen panel.
Step one: we weigh and press the sample, then separate the pulp from the skins and seeds. We centrifuge the pulp, and the clear juice goes to our OenoFoss instrument, which measures Brix, pH, titratable acidity, and—since 2017—tartaric acid, malic acid, and yeast-assimilable nitrogen (i.e. the quantities).
Step two: we incubate the skins and seeds with an alcoholic solution and cook them for three hours at 130 °F, then press them to extract a simulated fermented wine, which we centrifuge to remove solids.
Step three: we measure the spectra of both juices — the one from step one and the one from step two — and feed each of them into our phenolic model, described in a companion note [link]. This page on the website [link] describes the measurement process in detail.
We have been accumulating measurements of this kind since 2014: 331 samples over 70 block-vintages. Sampling runs weekly, from a median of 23 days after mid-veraison to a median of 49 — in the median block-vintage, three days before the pick. The blank corner is the 2014 planting of the four younger blocks; the asterisks through 2016 mark samples taken before the OenoFoss arrived.
The Right Clock: Days from Mid-Veraison
Everything in this note is measured in days from mid-veraison. In our archive, the samples are also dated and ordered by days to harvest, which is the useful clock for a picking decision but the wrong one for a model: it dates the past by an event that has not happened yet.
Veraison is not an instant. It takes 19 ± 6 days to go from 5% of berries changing color to 95%, and more than a month in the slowest block-vintages. We anchor on the midpoint — the day half the berries in a block have turned — and time every measurement by days from that day
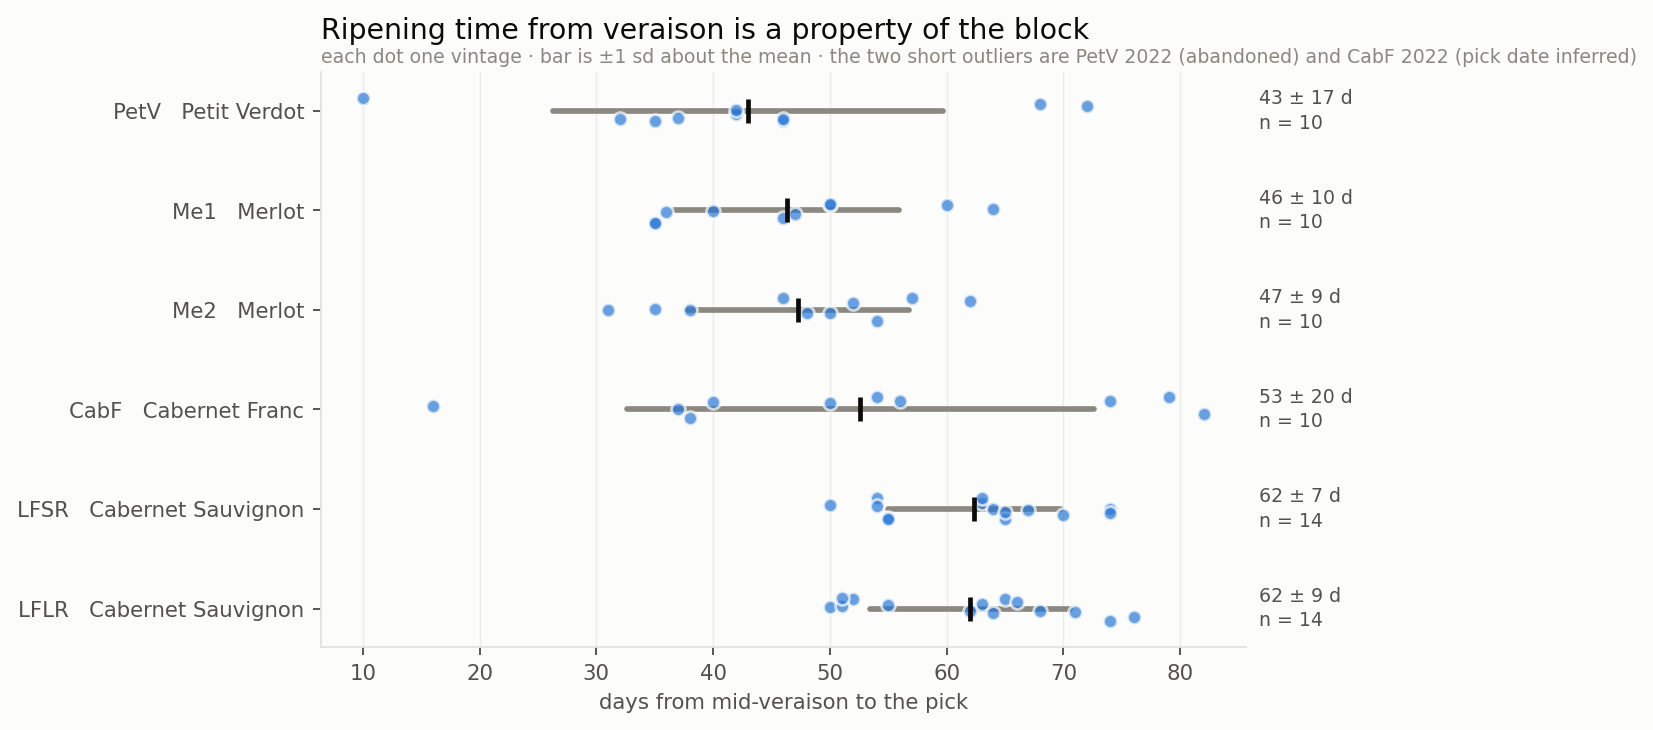
Figure 2. Days from mid-veraison to the pick. Each dot is one vintage.
The interval between mid-veraison and harvest turns out to be a property of the block. The two Cabernet Sauvignon blocks take about 62 days from mid-veraison to the pick; the two Merlots about 46. Cabernet Franc sits between them and scatters widely; Petit Verdot is the fastest and the most erratic. Me1 and Me2 agree to within a day — two Merlot blocks on the same property, ripening at the same rate. The two short outliers on the left are not ripening intervals at all: Petit Verdot 2022 was abandoned, and Cabernet Franc 2022 was picked with the Merlots on September 10 after a very late mid-veraison.
Four Types of Trajectories
Four shapes cover everything we measure — three with a bend or a curve in them and one a straight line — and which shape a quantity gets is settled by what the quantity is doing, not by which shape happens to fit best.
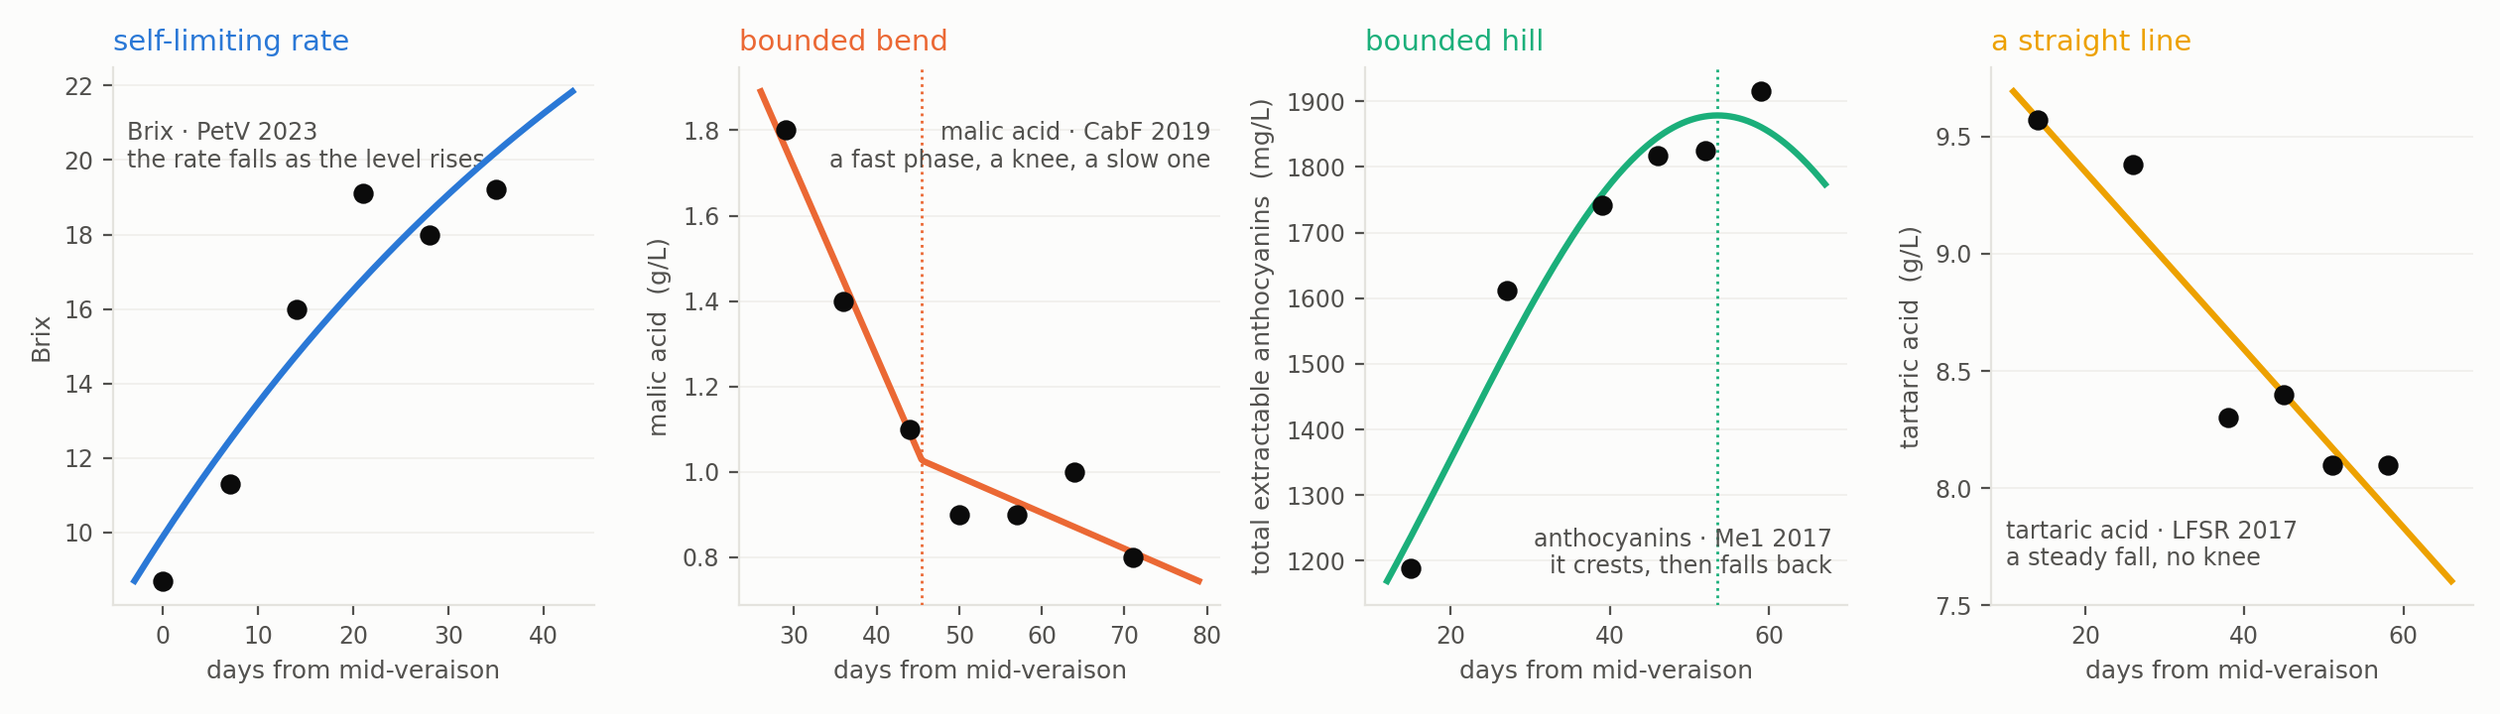
Figure 3. The four families on real block-vintages: a self-limiting rate, a bounded bend, a bounded hill, and a straight line. Dotted lines mark the knee and the crest.
First, a self-limiting rate for Brix. Its daily rate falls as its own level rises, so the deceleration is carried by the sugar the berry has already accumulated rather than by the calendar. A late vine does not slow down on a particular day; it slows down when it reaches a particular Brix. Three numbers describe it: the ceiling it is approaching, how fast it closes on that ceiling — 0.009 a day, borrowed from history — and the level it has reached.
Second, a bounded bend for pH, titratable acidity and malic acid: a fast phase, a knee, and a slower phase that continues to the pick. Four numbers describe it: the knee day, the level at the knee, the slope before the knee, and the slope after. The last of those is not fitted. It is held at a fixed fraction of the slope before — 0.46 for pH, 0.11 for titratable acidity, 0.19 for malic acid — so three numbers are actually fitted. Those fractions are measurements, not choices: each is the median of the same ratio fitted freely across the archive, and they differ because the quantities differ. pH keeps climbing after its knee at nearly half its earlier rate, while titratable acidity almost stops falling.
Third, a bounded hill for anthocyanins, the one quantity that genuinely crests and comes back down. Four numbers: the crest day, the height at the crest, the baseline it decays to, and the width of the hill — 33 days, borrowed. Bounded means that past the crest the curve decays toward that baseline instead of diving without limit, which is what keeps the crest date sane in a season whose samples stop early.
Fourth, a straight line for tartaric acid, described by a level and a slope. It declines at 0.035 g/L a day with no knee at all, losing about a tenth of itself across the window while malic loses three quarters. A line through the points is the whole model.
Nitrogen gets none of the four. It fits a curve at a median R² of 0.62, and the knee search runs to whichever bound it is given; the series will not support a shape. So we do not give it one. We record the readings and use them as-is, on the dates they were taken; we do not interpolate between them or project past them.
Alignment
To compare and pool samples, we need to align them. No two block-vintages were ever sampled on the same day of their own season: one block was caught at day 23 and again at day 44, another at day 31 and day 52. So the samples aren't comparable. The trajectory removes that problem, because it has a value on every day of the season, including the days nobody sampled.
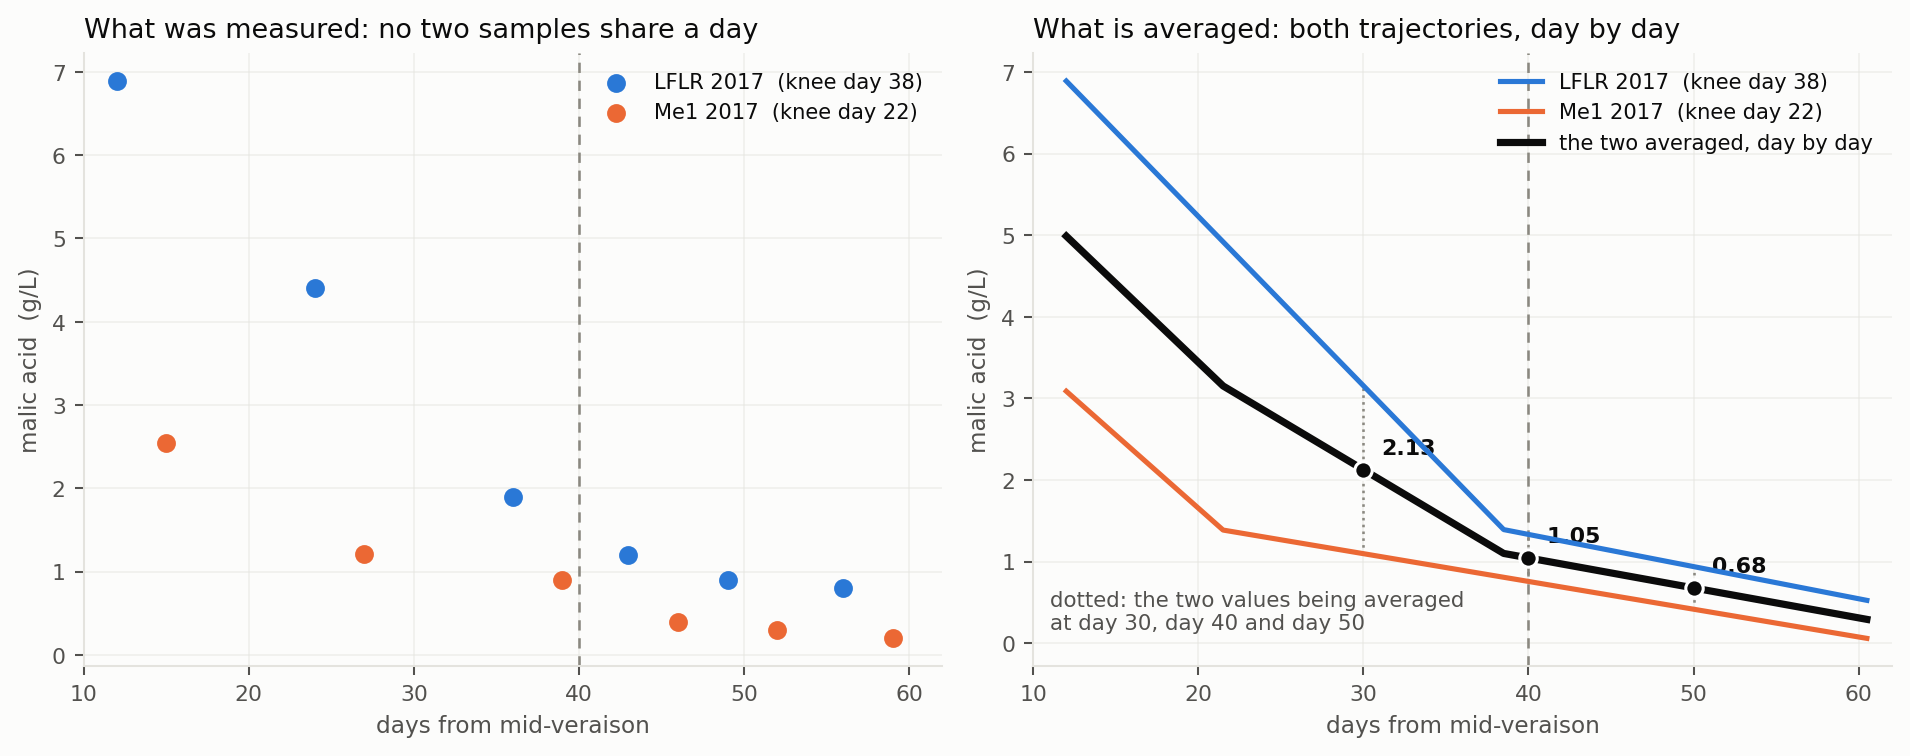
Figure 4. Left: the problem — two block-vintages, ten malic acid samples between them, and not one shared date. Right: the fix — each series becomes a trajectory, and the two can then be read, and averaged, on any day.
The left panel of Figure 4 is the problem and the right panel is the fix. Once each series is a trajectory, pooling is a matter of reading both on the same day and taking the mean. At day 30 these two read 3.16 and 1.10 g/L, so the pooled value is 2.13; at day 40, 1.33 and 0.76, so 1.05; at day 50, 0.94 and 0.42, so 0.68. Every pooled curve in this note is built that way — a day-by-day average of fitted trajectories, never an average of samples.
One thing that example shows is worth keeping in mind. The two cells bend on different days, day 22 and day 38, so their average bends at neither: pooling rounds off a knee that each block-vintage has sharply. That is why the shape constants are fitted one cell at a time and pooled afterwards, rather than fitted to a pooled curve — the pooled curve is a weaker version of the thing we are trying to measure.
So we read every trajectory on one common day—day 40, forty days after mid-veraison—and store two numbers from it: the level it has reached, and how fast it is moving there. That pair underpins the rest of the work. It is how Me1 is compared with Me2 in the same season, how 2026 is compared with 2019 in the same block, how a block's own history becomes the prior for the season now running, and how a season is called early or late at all. Day 40 is the choice for two reasons. It sits inside the sampling window in 90 % of the block-vintages with a full series, and in 81 % of every cell including the thin early ones, so the reading is usually an interpolation between two real samples rather than an extrapolation past the last one — and a trajectory interpolates well and extrapolates much less well. And the rate is better determined there than at any earlier day we tried: moving the anchor from day 35 to day 40 cuts the standard error on the pH, titratable acidity and malic acid rates and widens the spread between block-vintages relative to it, which is what makes a comparison worth making.
The rate needs care on a trajectory with a knee. The instantaneous slope jumps at the knee, and the knee does not sit in the same place every year: it falls after day 40 in about a quarter of block-vintages and before it in the rest so that a single-day slope would be the steep pre-knee rate for some cells and the flat post-knee rate for others. On titratable acidity, those two differ by a factor of nine. So the stored rate is the average slope across the ten days around day 40, not the instantaneous slope. Where the knee is far away, the two readings match to the last decimal; where it is close, they differ by up to half, and the average is the one that means the same thing in every cell.
Shape from History, Shift from This Season
Fitting three or four free parameters to five or six samples doesn't work; one season doesn't have enough data to support it. But the shape of each trajectory — the width of the anthocyanin hill, the ratio of the two slopes across a bend — is a property of the variety and the site. It barely moves between seasons, and we have many more samples once we pool all the vintages. So we estimate the shape from every observation a block has ever given us.
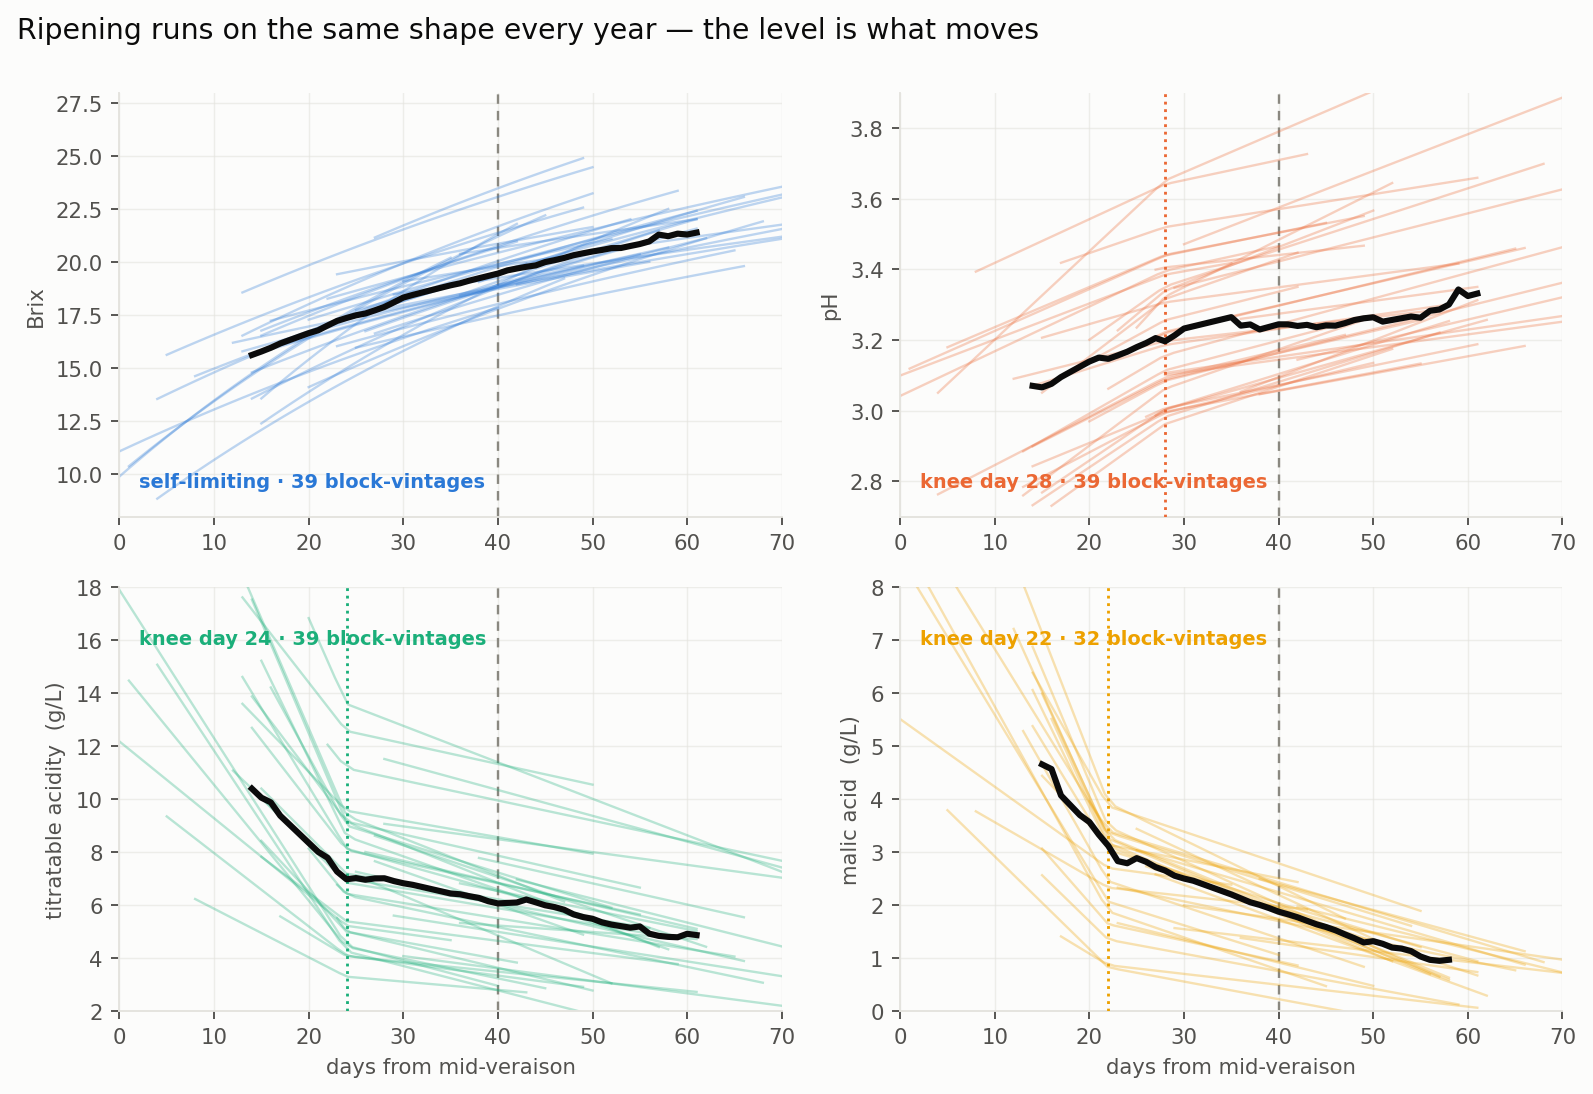
Figure 5. Four chemistries, every fitted block-vintage, on the veraison clock. One faint line per block-vintage; black is the median; the dotted line is the knee where there is one, and the dashed vertical is the day-40 anchor. The shape repeats; the level is what moves.
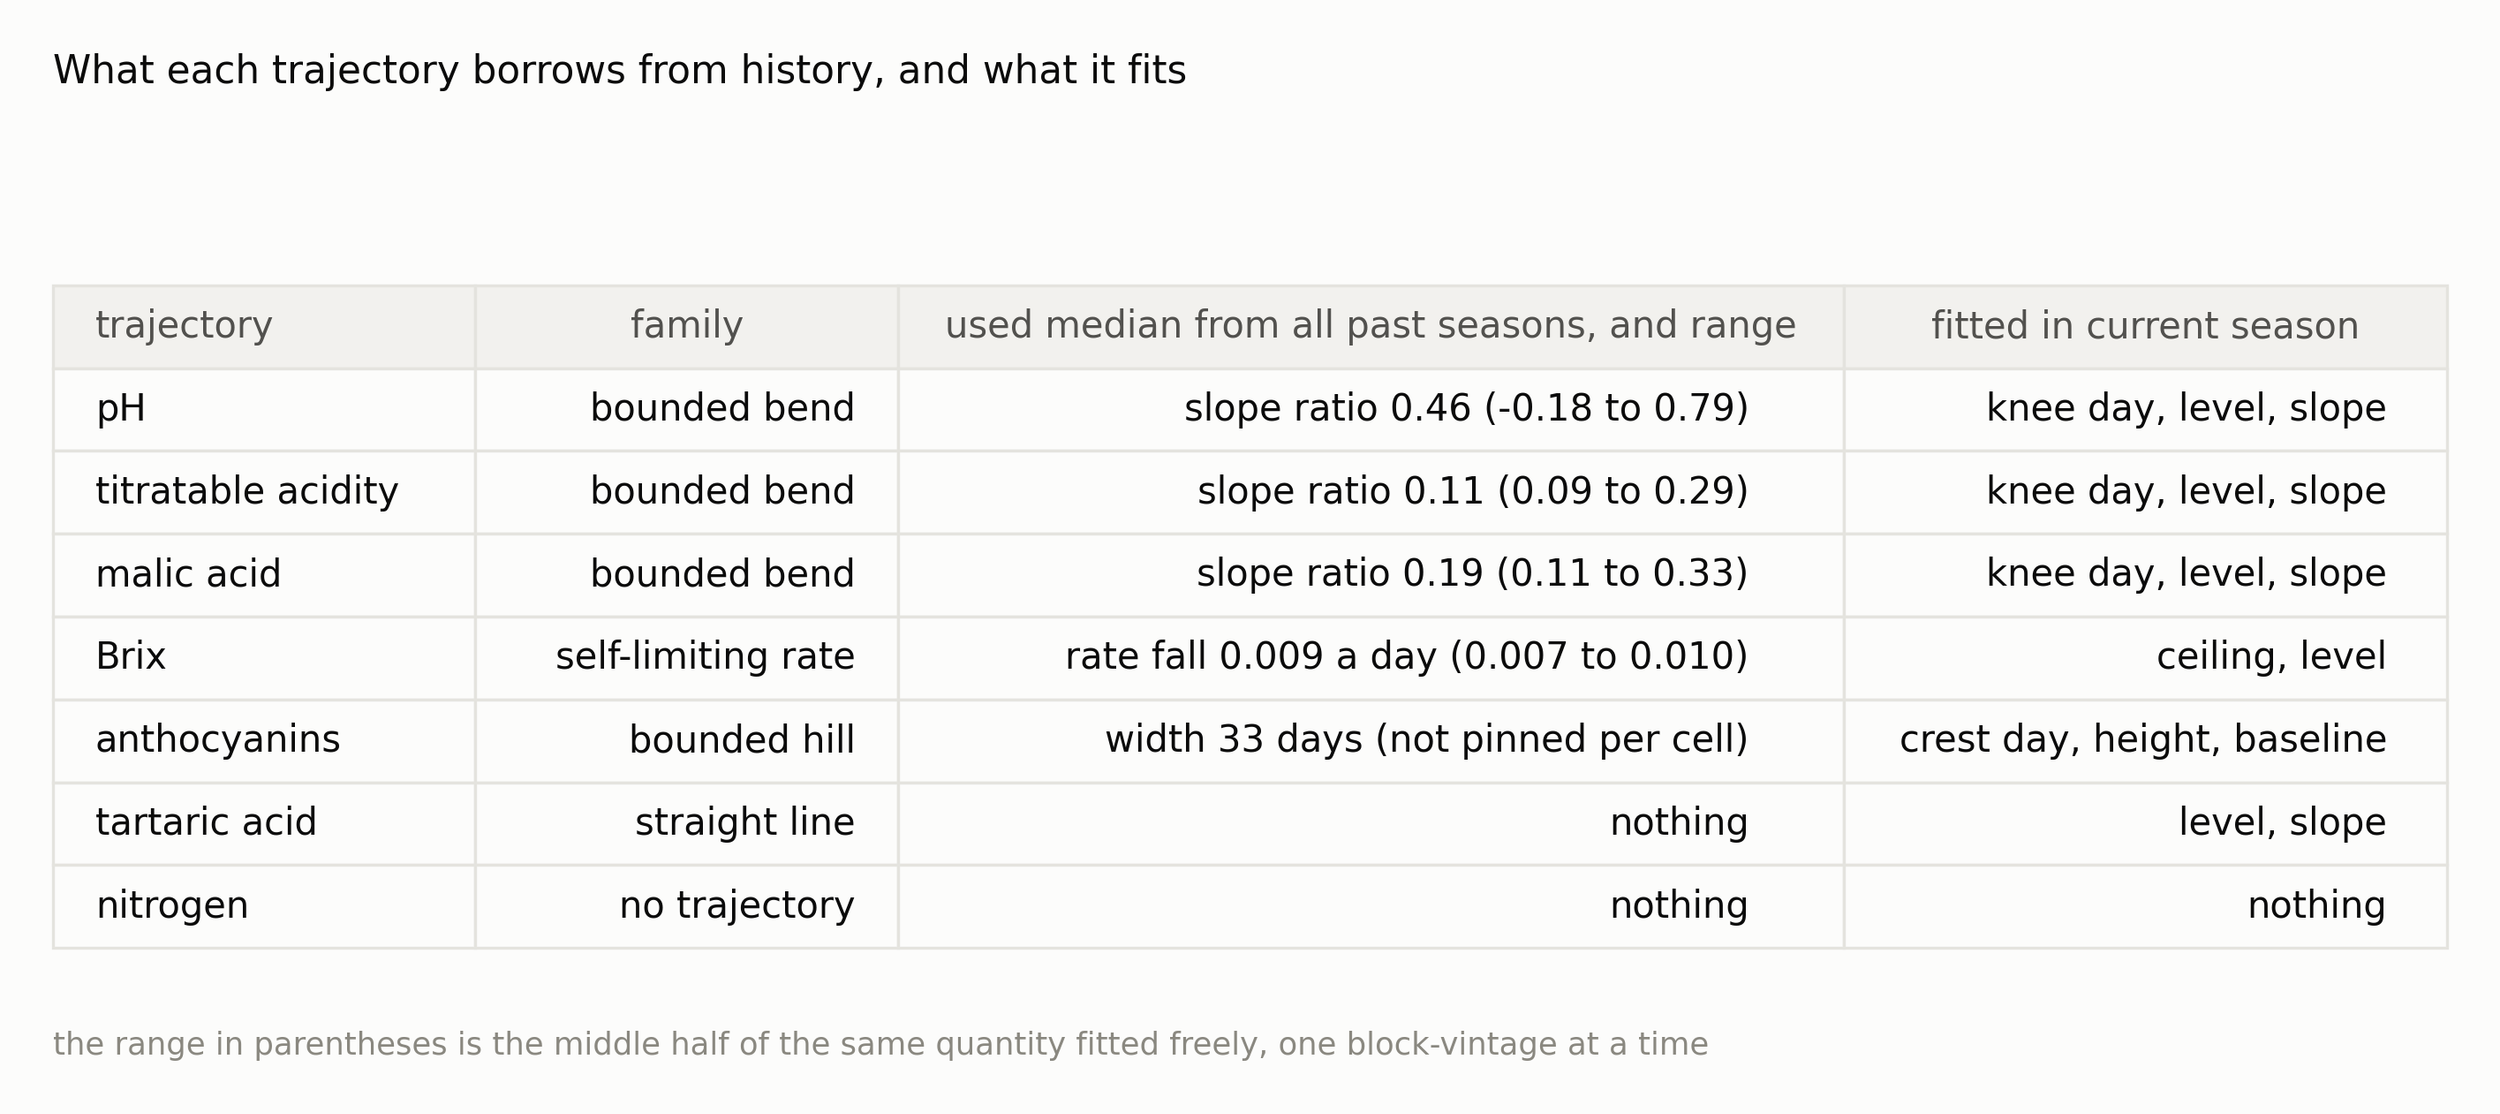
Figure 6. What each trajectory borrows from past seasons and what it fits to the data in the current season. The borrowed numbers change only when a season is added to the archive
Where the trajectory sits in time moves every vintage, because it depends on the weather and the season's accumulated heat. That day — the knee day for a bend, the crest day for a hill — is the only thing we search for. We don't search for the level and the slope at all: once the day is fixed, they are whatever least squares says they are, so the position is a single number, and the rest follows from it.
At the start of a season we have no samples, and the day starts at the average of the block's past seasons. By the end, we have enough samples to estimate it from the current season alone. In between, we combine the two as a weighted average, described below.
Borrowing the shape has a second benefit that matters more than it sounds. With the shape fixed, the model is linear in its remaining parameters for any candidate position, which turns the whole fit into a one-dimensional search with a closed-form regression inside it. It needs no optimizer or starting value, and it works with as few as three samples.
How we find the Shape and the Position
In two steps, and only the second one runs during the season.
The shape, once, from history. For a bend, the shape is the ratio of the two slopes. Pooling every complete series in the archive, we fit two slopes and a knee freely to each one, then take the median ratio—the numbers in Figure 6. For the anthocyanin hill, the shape is its width. These constants are recomputed when a season is added to the archive and are otherwise held fixed.
The position is found by search, from this season. Take a candidate day for the knee. With the shape fixed and the knee placed on that day, the trajectory has two free parameters left — the level at the knee and the slope running into it — and it is linear in both, so the best pair has a closed-form least-squares answer, and the residual sum of squares that comes with it is a single number. Do that for every candidate day on a half-day grid across the plausible range, and keep the day whose residual sum of squares is smallest.
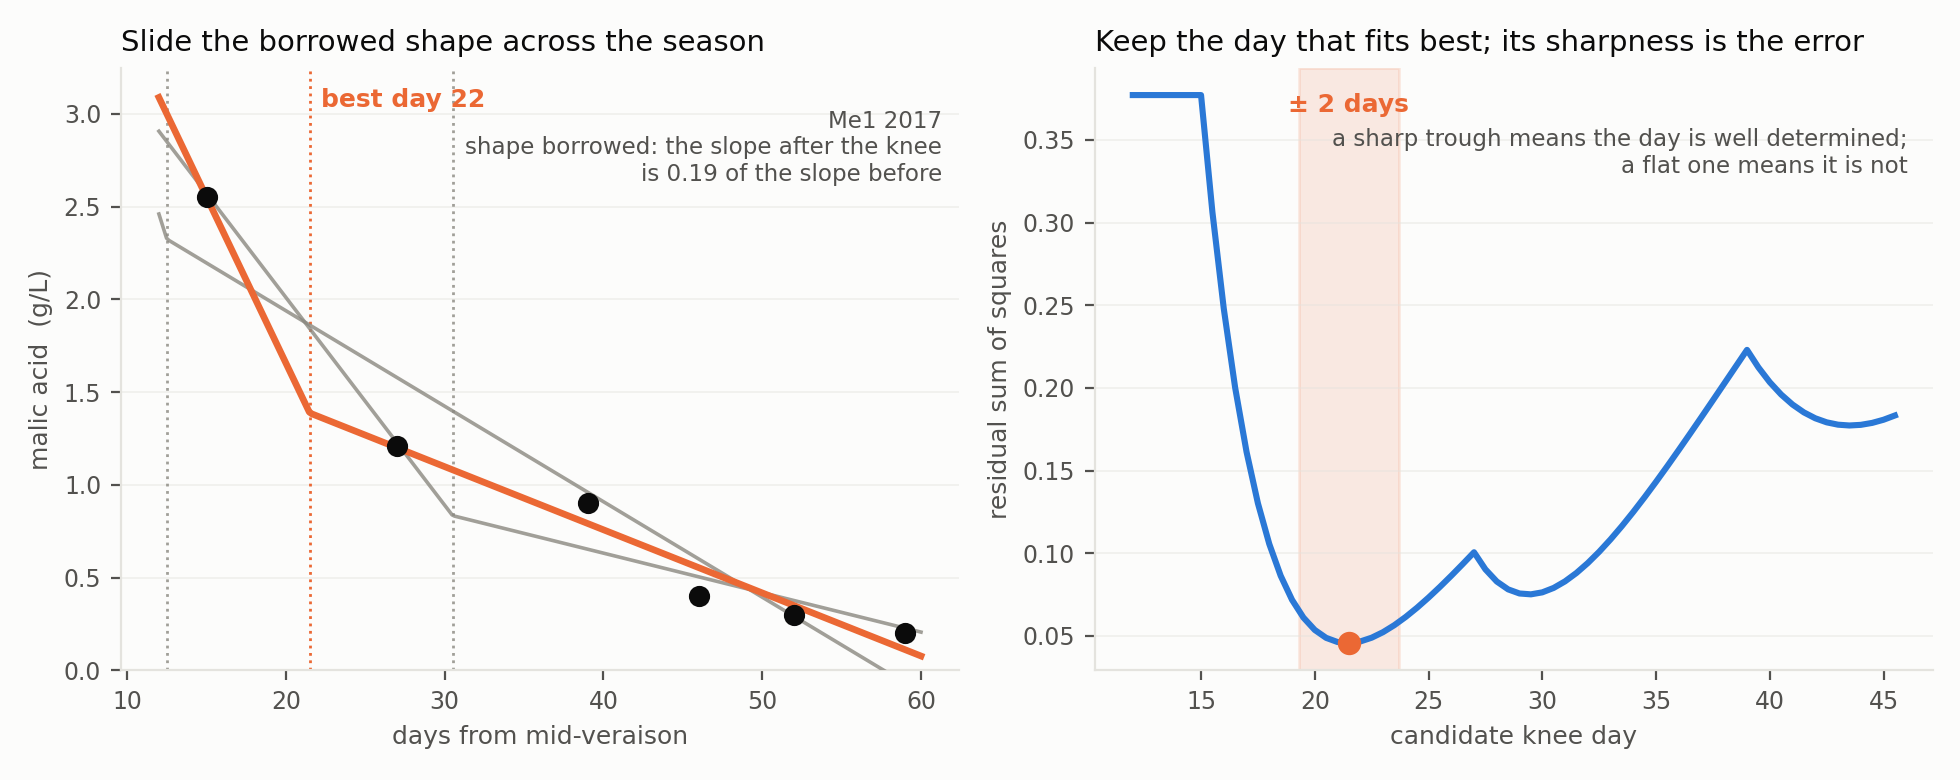
Figure 7. Finding the position. Left: the borrowed shape slid across three candidate days against the samples of one block-vintage. Right: the residual sum of squares at every candidate day, with the day that wins and its uncertainty band.
The same profile gives the uncertainty, which is the point of doing it this way. Near the best day, the residual sum of squares rises roughly as a parabola; the sharper it rises, the better the day is pinned, and the standard error is read off that curvature. We then double it. That profile answers a narrower question than the one we care about — it asks how well the day is pinned given the borrowed ratio, and treats the borrowed ratio as exact. It is not exact. Moving it by one archive standard deviation moves the fitted day by 2 to 4 days, about as much as the profile error itself, so the two combine to 2.0 to 2.5 times the profile standard error, depending on the variable. Two is that number, rounded.
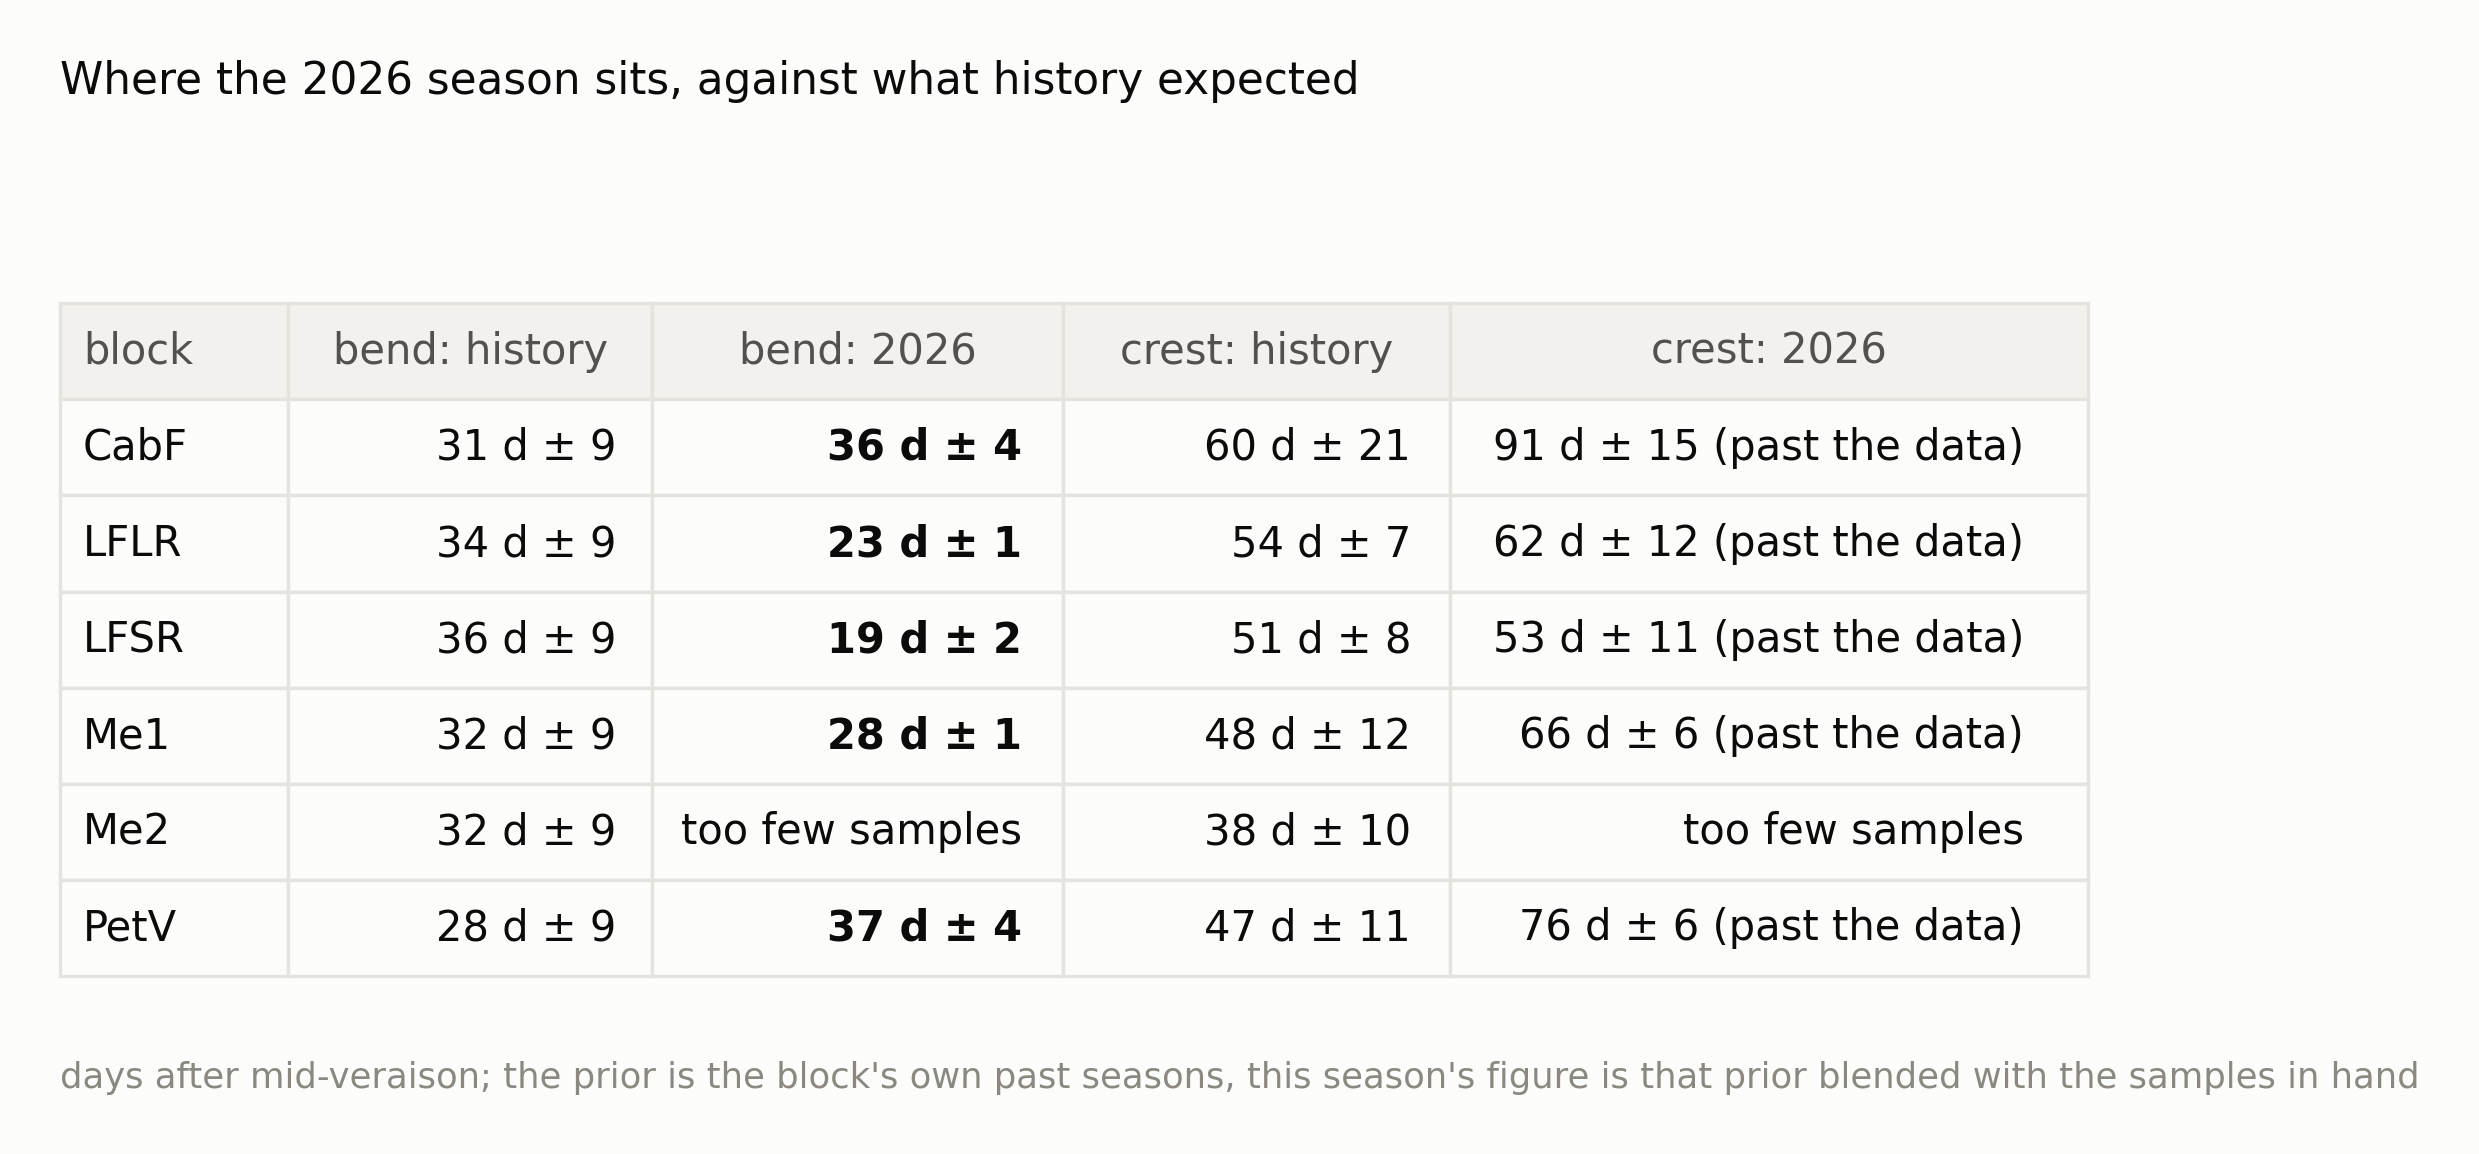
The blend with history. The block's past seasons give a prior—a mean day and a spread—and the search gives an estimate with a standard error. The two combine via inverse variance. From three samples, the prior carries most of the weight; by the end of a season, the samples carry nearly all of it; the weight moves continuously, and no one decides to switch at any moment.
Figure 8. Where the 2026 season sits against what history expected. Every crest estimate this season still lies past the last sample taken, meaning the color has not turned over yet in any block
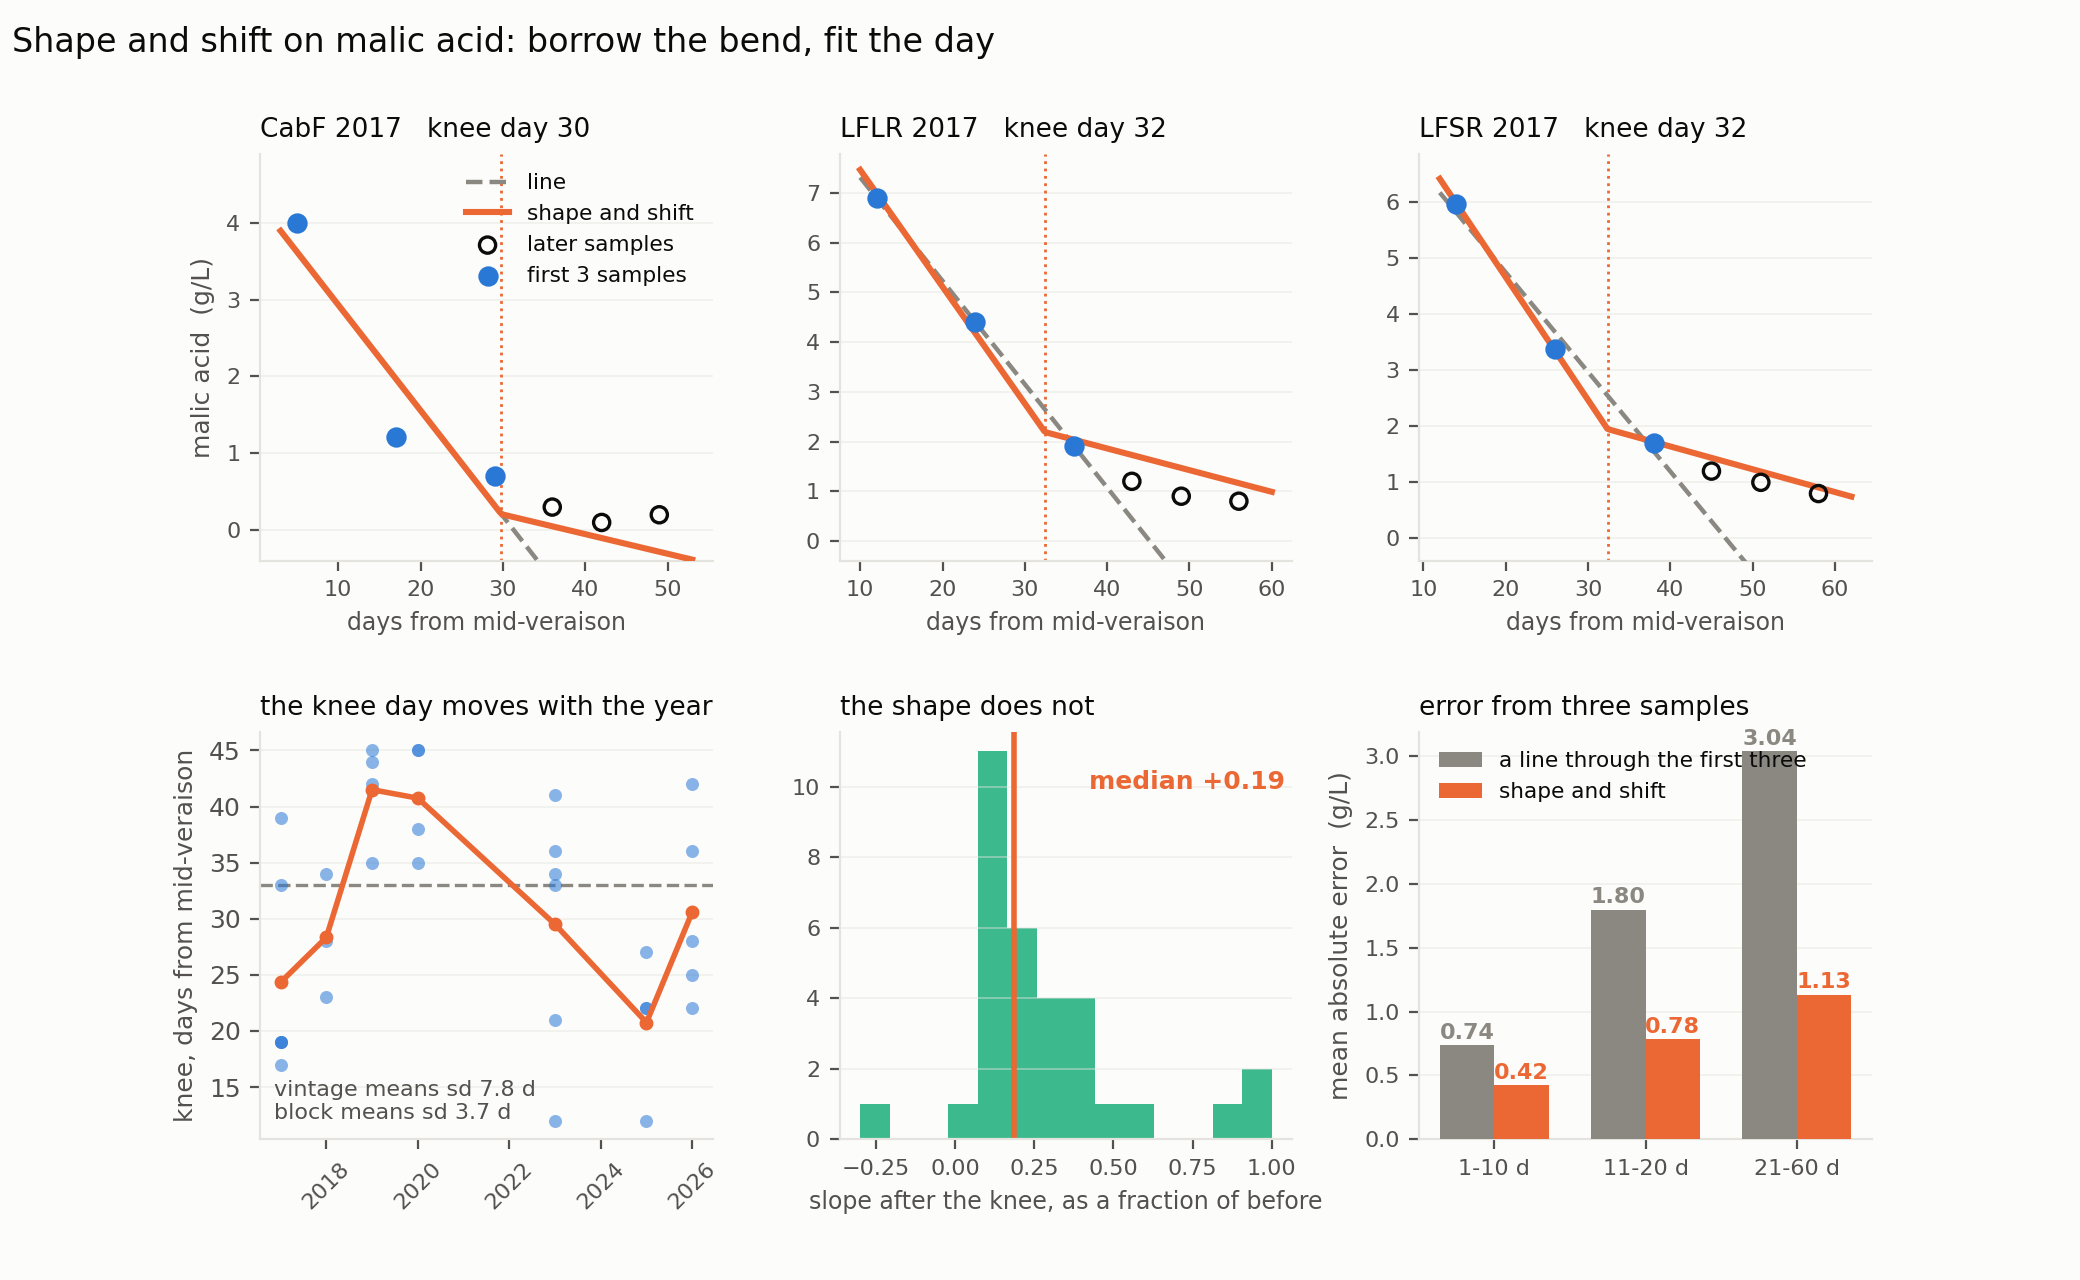
Figure 9. Borrowing the bend and fitting only the day. From three samples, the fitted trajectory tracks the later ones; a straight line through the same three runs off the bottom of the chart.
On malic acid and titratable acidity, predicting every later sample of a season from only its first three, this is worth about half the error of fitting each season's trajectory freely. "Gain" in this note always means a reduction in prediction error against a stated baseline, scored leave-one-vintage-out. Here there are two baselines worth naming. Against the free fit — the same trajectory with both its shape and its position estimated from those three samples — the error roughly halves. Against the cruder baseline of a straight line through the three samples, the improvement is larger, and it divides unevenly: roughly nine tenths of it comes from having a bounded shape at all, and the last tenth from fitting the position.
A Season's Fingerprint
Seven measurements, one block, one season, and each one fitted the way its family says. That is the whole model for one block-vintage: seven trajectories and, behind them, twenty-odd numbers, four of which came from the block's own history and the rest from the block-vintage's samples.
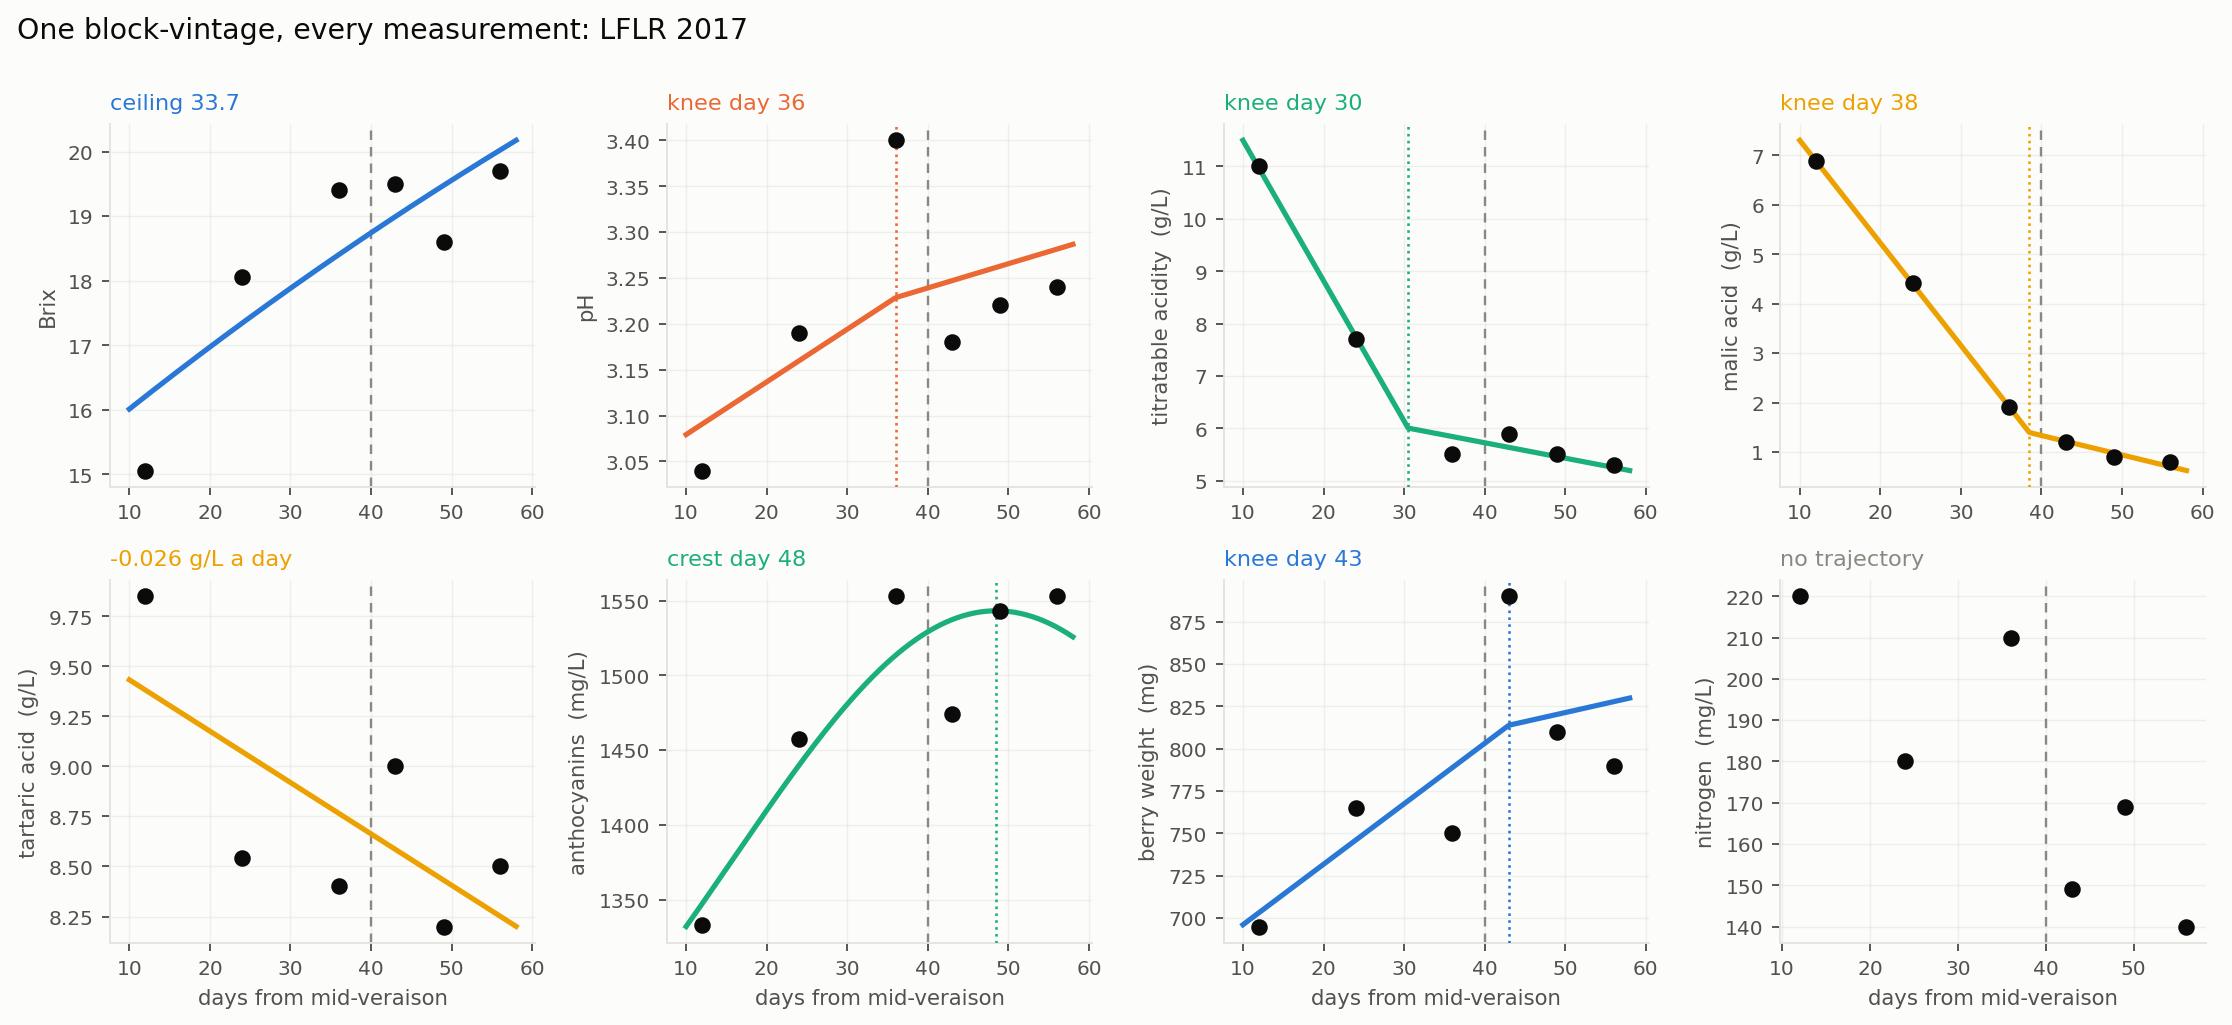
Figure 10. One block-vintage, every measurement, each with the trajectory its family gives it. Dotted lines mark the knee or the crest; the dashed vertical is the day-40 anchor. Nitrogen gets points and nothing else.
Typical fit quality, as median R² per block-vintage: pH 0.97, titratable acidity 0.97, malic acid 0.97, Brix 0.96, tartaric acid 0.82, berry weight 0.64, nitrogen 0.62.
Berry weight fits worst of the physical measurements, and not because the underlying trajectory is rough. A hundred-berry mean scatters 4.1 % about its own trajectory, which is a noisy way to weigh a berry — the scatter in that panel is the sample, not the fruit.
This is also why we fit a trajectory through a whole series rather than differencing consecutive samples. Differencing two hundred-berry means nearly doubles their noise, which over a week exceeds the effect being measured. The fit averages the noise down, and the scatter around it directly measures how noisy one sample is.
The spread between the faint lines in Figure 5 is the season-and-block variation, and it is large. At the anchor, Brix across the archive runs from about 17 to 27 and pH from below 3.0 to above 3.7. Season and block move the level far more than they move the shape.
The Bend: One Event in Five Measurements
The search described in the previous section finds every knee in this note — one candidate day at a time, with the shape held fixed. This section adds that the day does not have to be found five separate times.
Brix, pH, titratable acidity, malic acid and berry weight all bend within a few days of each other.
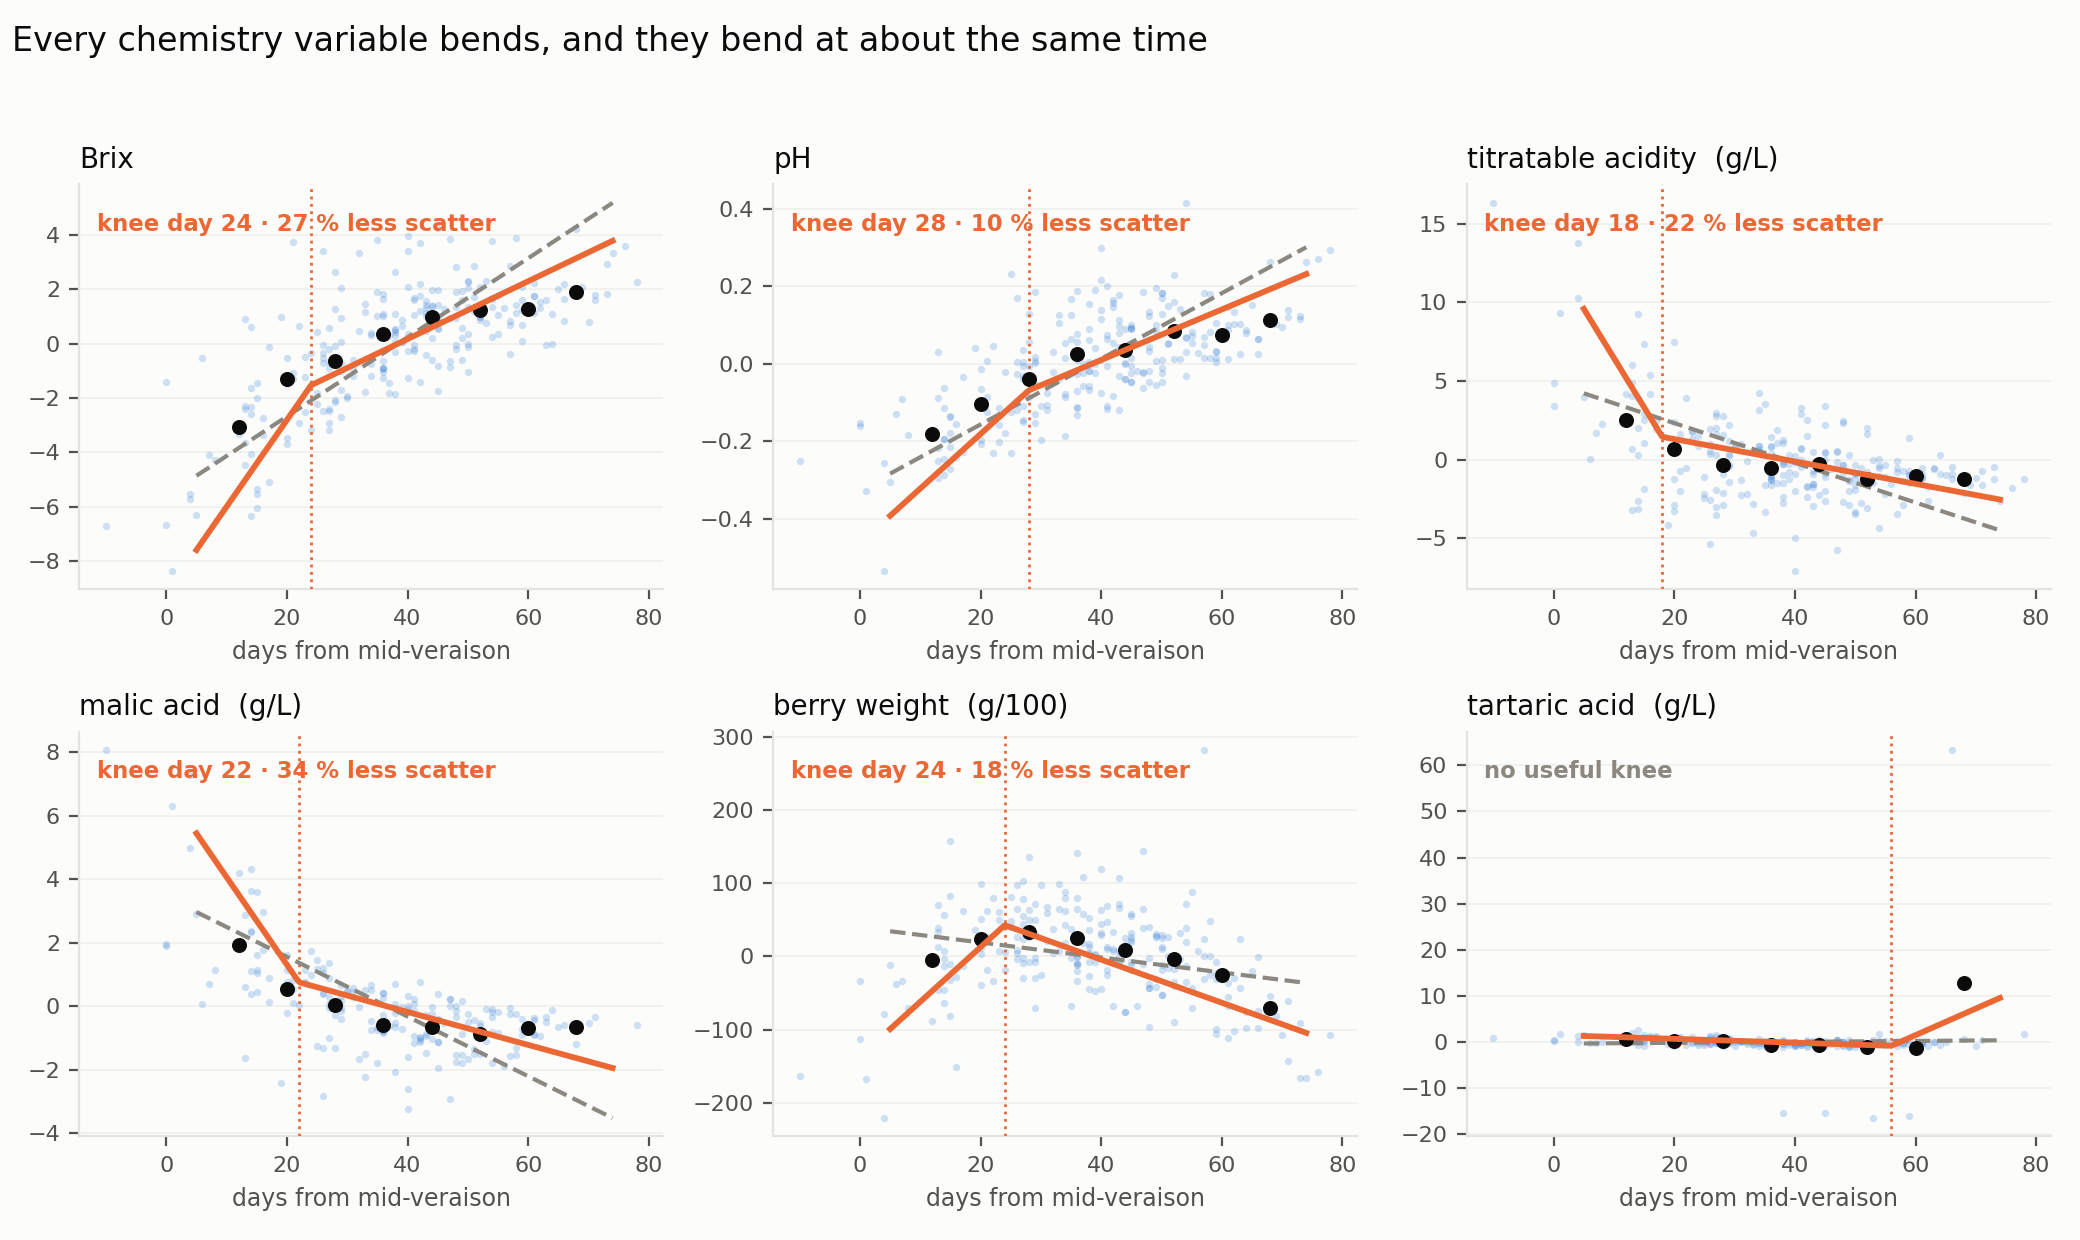
Figure 11. Every chemistry variable bends, and they bend at about the same time. Dashed gray is one straight line; solid is two slopes with a knee.
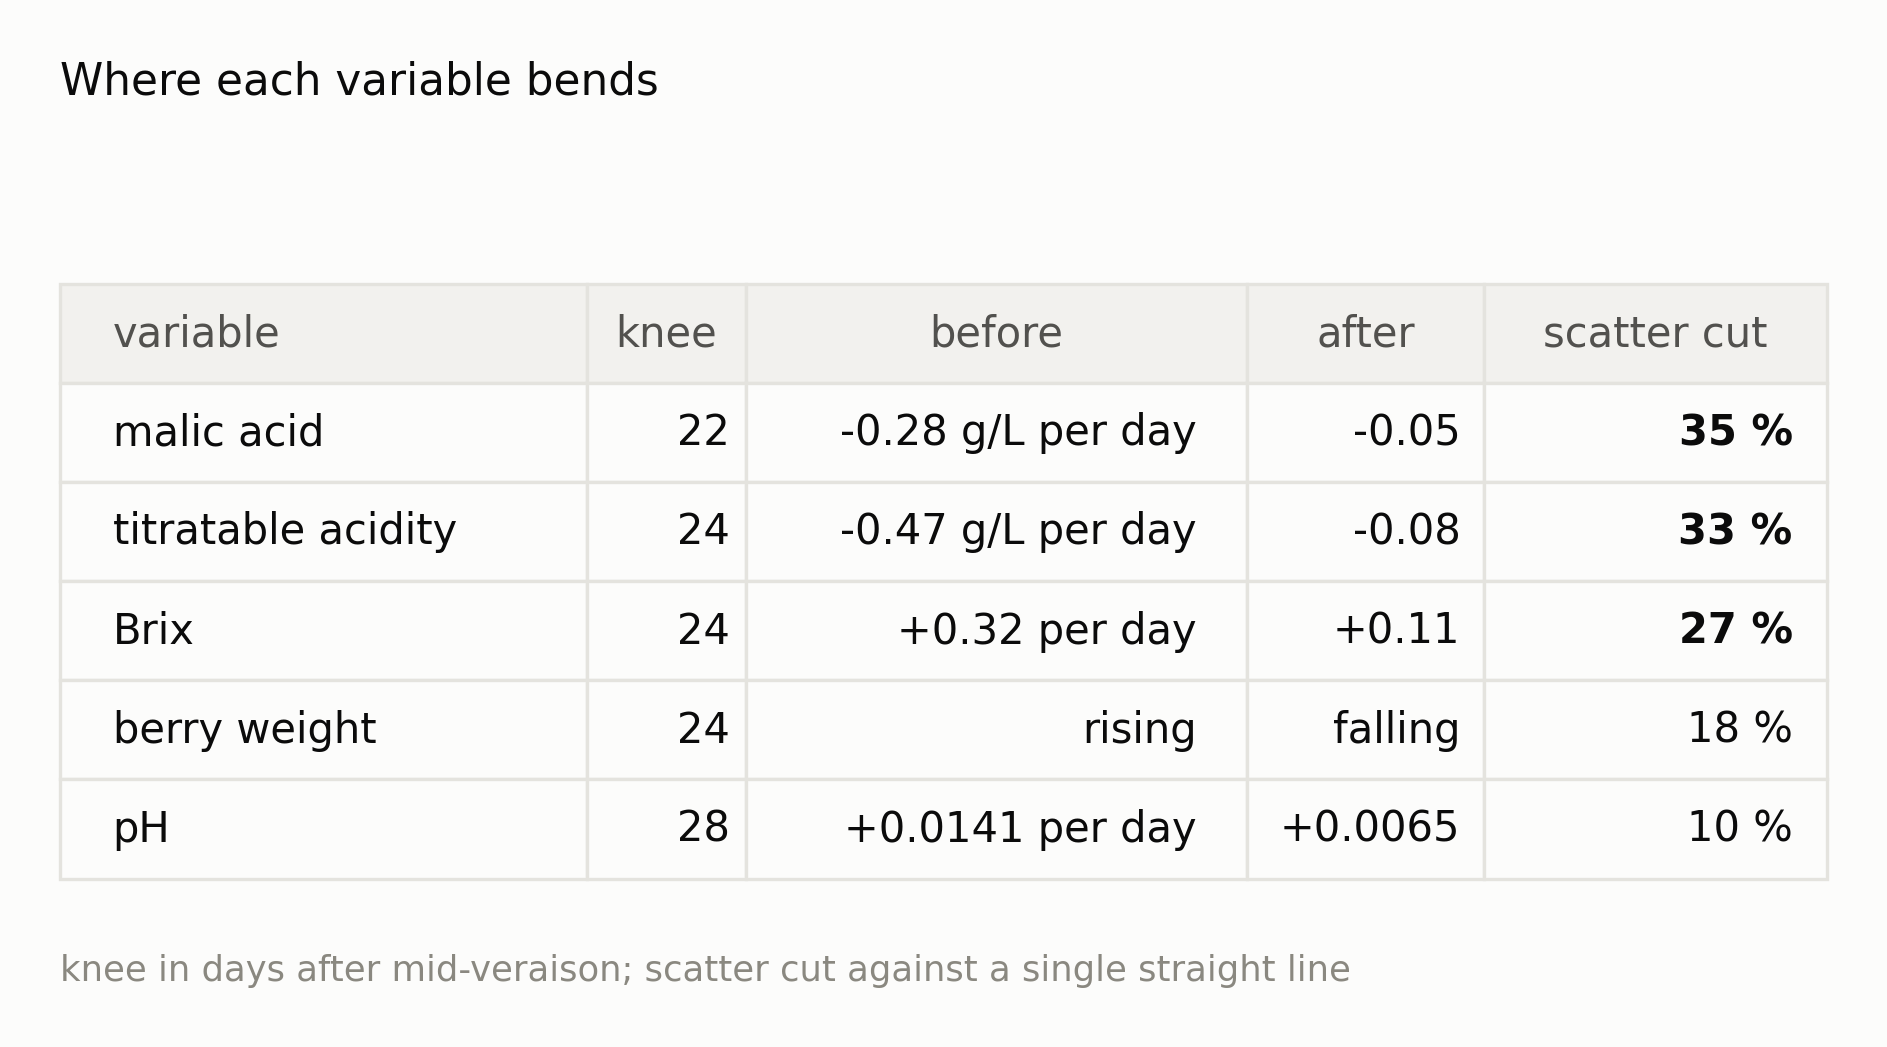
Figure 12. Fitting two slopes rather than one cuts the scatter by a third on the acids.
Five variables bending within ten days of each other could be five coincidences. It is not. Within a single block-vintage the five knees move together: every pairwise correlation runs from +0.38 to +0.85, and 68 % of the variation in knee day belongs to the block-vintage rather than to the variable.
So there is one bend date per block-vintage, measured five times. Fitting all five series at once locates it to a standard error of 2.2 days from the first three samples of a season, and 1.7 days on a complete one. Across 57 block-vintages it falls at a median of 32 days after mid-veraison with a standard deviation of 11 — the event moves by weeks between seasons, and we can place it within a couple of days.
The five do not bend in the same instant, and the order is the same every year: the berry stops growing about three days first, sugar and the two acids turn together, and pH is last by roughly a week.
The Bend Is the End of Inflow
Brix is sugar divided by juice, so it can climb on water leaving as easily as on sugar arriving. As we weigh the berries and measure the juice, we can separate the two.
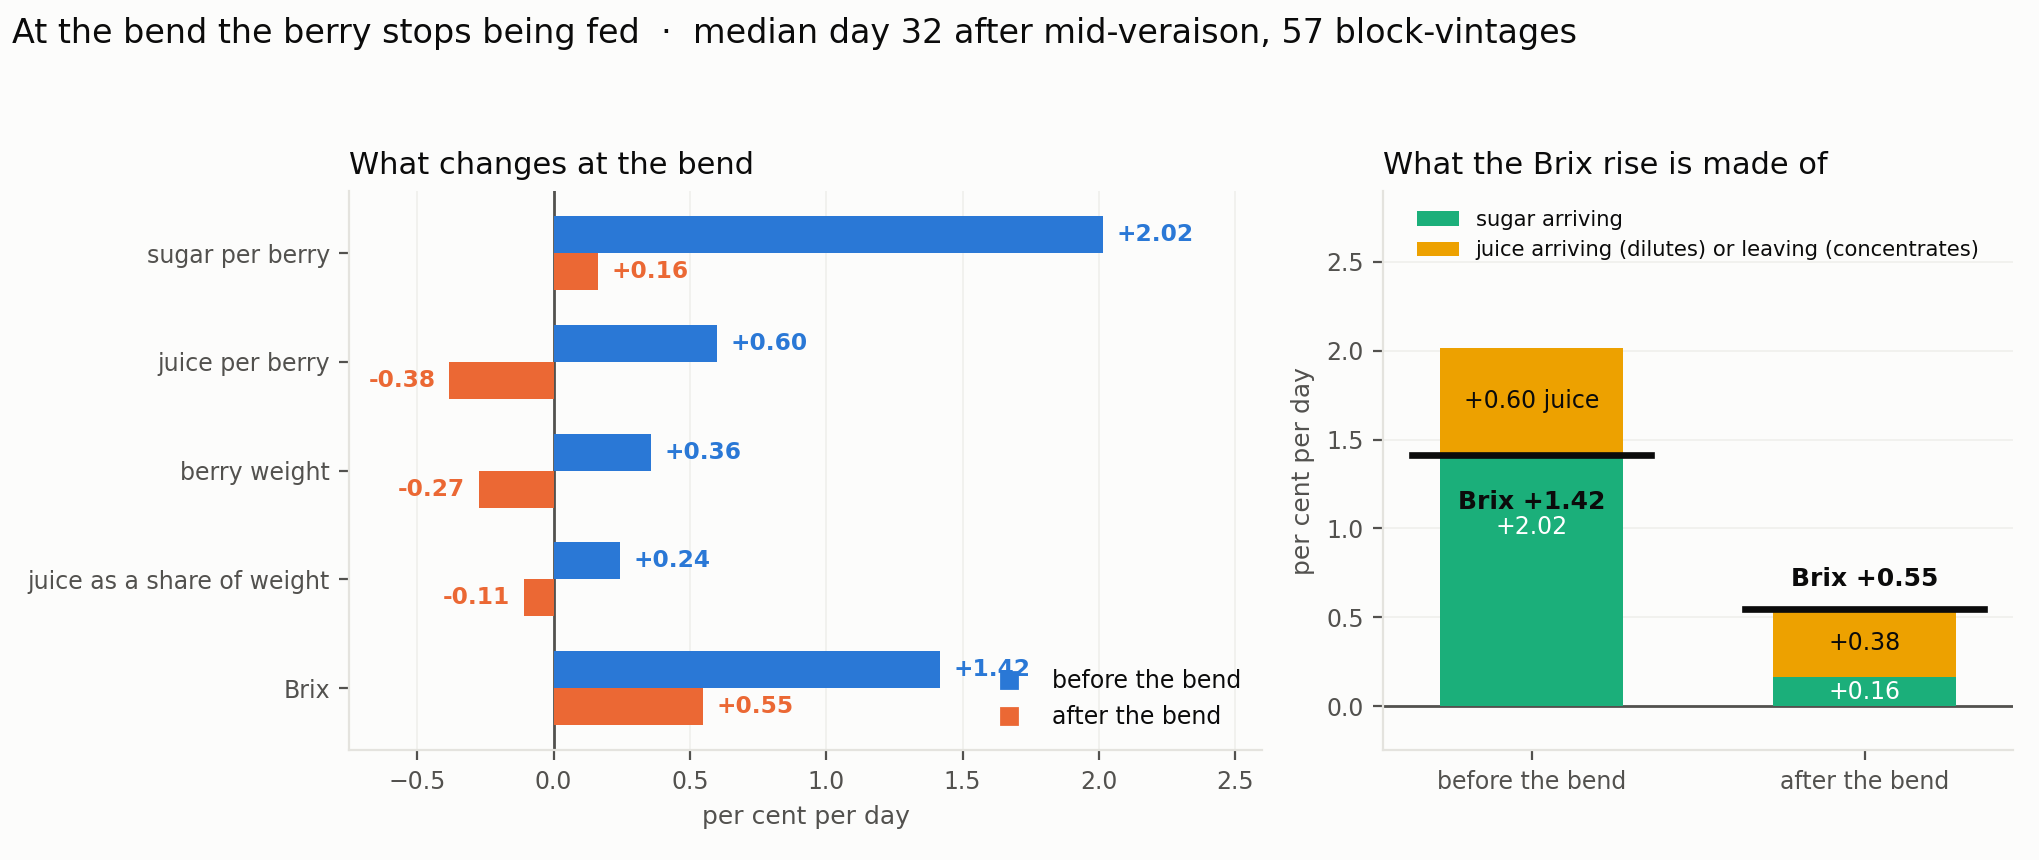
Figure 13. At the bend the berry stops being fed. Left: rates before and after each block-vintage's own bend date. Right: what the Brix rise is made of.
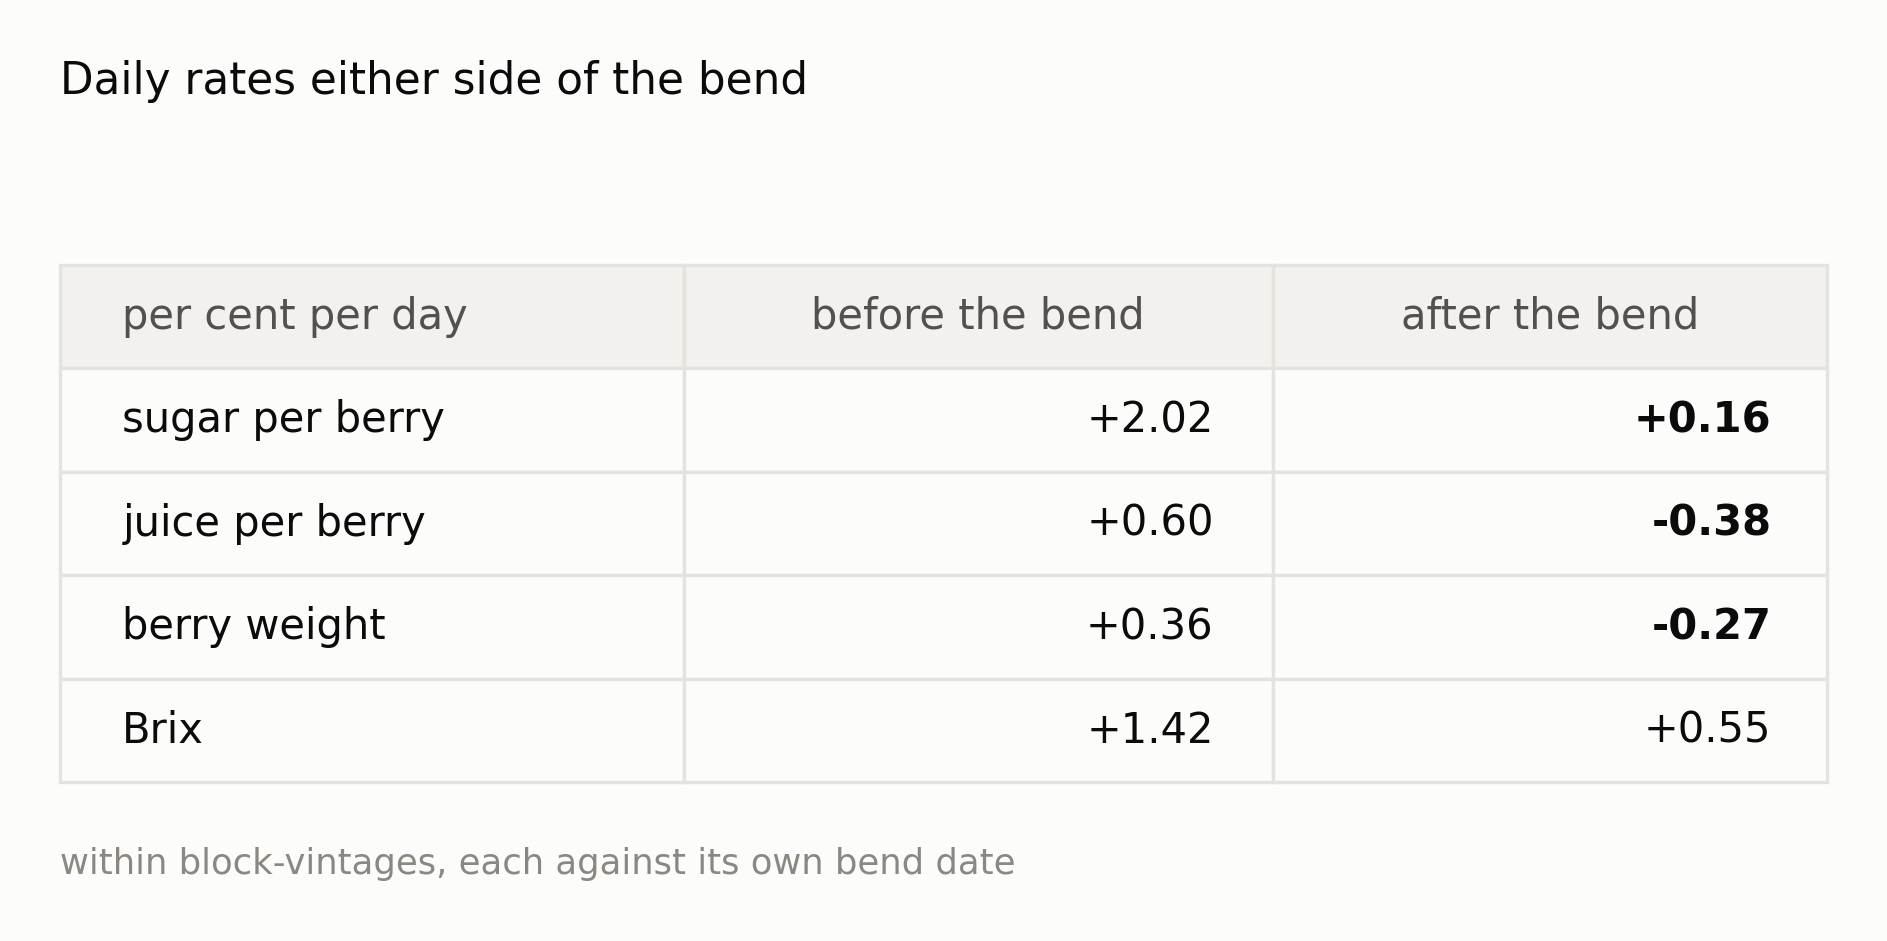
Figure 14. Sugar accumulation falls to a twelfth of its rate; water inflow reverses.
Sugar accumulation falls to about a twelfth of its rate and is indistinguishable from zero; past two weeks beyond the bend, the median change is 0.03% a day. Water inflow reverses, and the berry turns from growing to shrinking.
The arithmetic closes on both sides. Brix's rate must be the sugar rate minus the juice rate, and the two sides are measured independently: +2.02 − 0.60 = +1.42 before the bend against +1.42 measured, and +0.16 + 0.38 = +0.54 after against +0.55 measured.
Which gives the finding this section exists for. After the bend, about 70 % of the remaining Brix climb is water leaving and 30 % is sugar still arriving. Late Brix is largely a dehydration measurement. Sugar per berry is the quantity that keeps its meaning, and we record everything needed to compute it.
Color: The One Trajectory That Crests
Total extractable anthocyanins are the sum of what is already in the pulp and what can be extracted from the skin, roughly 10 % and 90 % of a typical total near 1,700 mg/L. We do not measure them by wet chemistry; we estimate them from the sample spectrum, and this note uses only that estimate. The instrument's own reading is not a fallback, so a sample whose spectrum was never captured (or lost) carries no anthocyanin value at all. This section rests on 247 samples over 60 block-vintages rather than on the whole archive.
What we can quote about accuracy is narrower than it first appears. Scored leave-one-vintage-out, our spectral model reproduces the recorded reading to R² 0.95 and a mean error of 7 mg/L on the pulp fraction, which is typically 187 mg/L, and to R² 0.71 and 90 mg/L on the skin fraction, which dominates the total. Propagating both gives about 5 % of a typical reading. But that is the accuracy of turning a spectrum into the number the instrument would have reported — agreement inside one measurement chain. It is not the accuracy of either number against a wet-lab determination. Nothing in this archive has been checked against HPLC or a Somers assay, so the chain's own offset from the truth is unmeasured, and every anthocyanin statement in this section is about how the quantity moves, not about its absolute level.
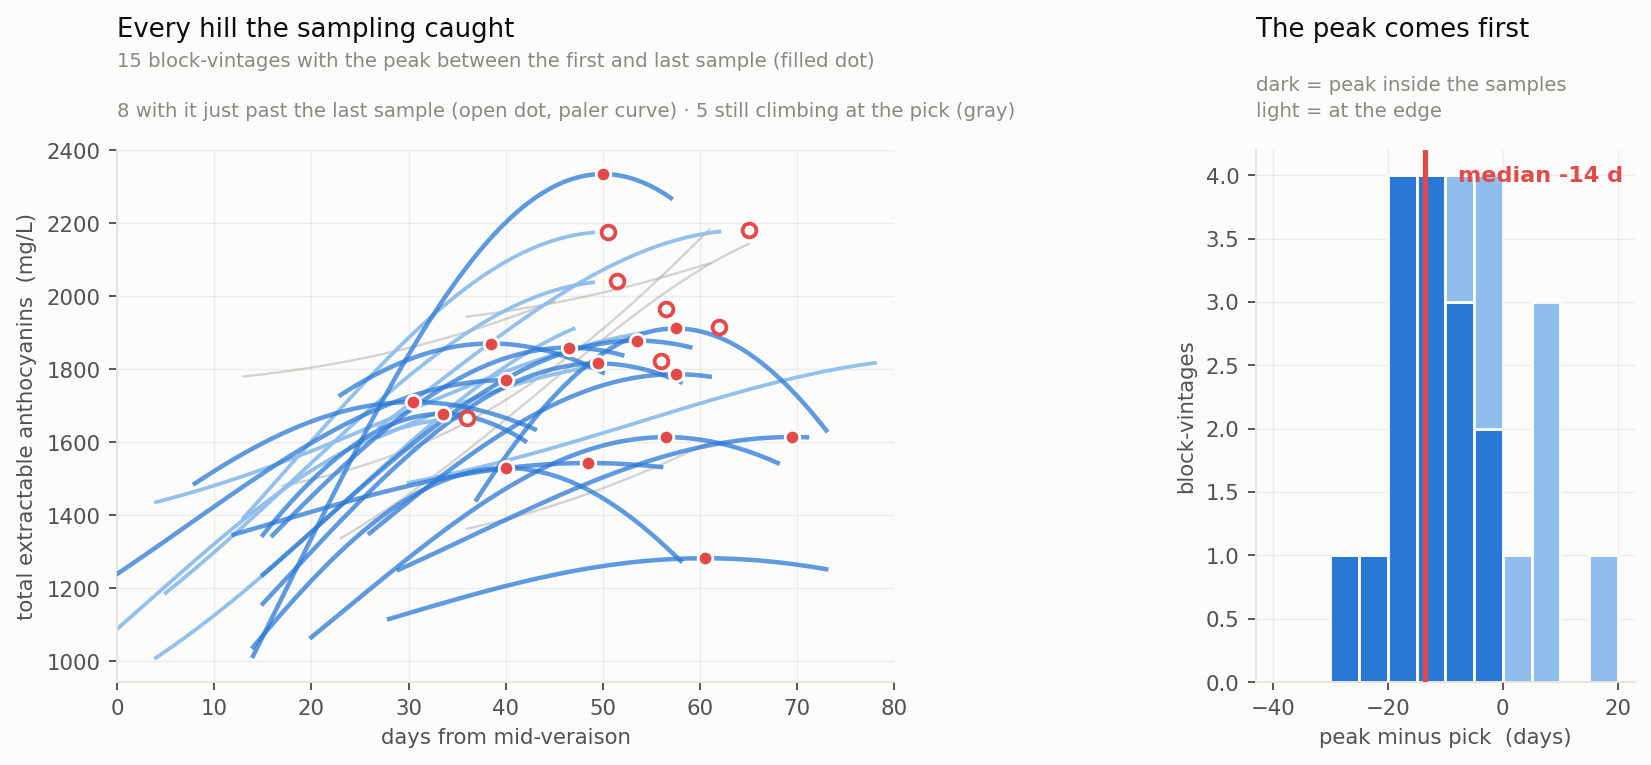
Figure 15. Left: every anthocyanin hill the sampling caught. Right: where the crest falls relative to the pick.
Fitted per block-vintage over the completed seasons, 15 block-vintages put the crest between their first and last sample. Those crests arrive a median 50 days after mid-veraison at a median height near 1,770 mg/L, and in all 15 the crest comes before the pick, by a median of 14 days. A further eight place it just past the last sample, effectively at the pick; five more—both Cabernet Sauvignon blocks in 2020, Me2 and PetV in 2017, and PetV 2019—were still climbing when the fruit came in.
The falling limb is barely sampled and cannot be otherwise, because harvest ends the series. Sampling already runs to within a few days of the pick, and after the pick there is nothing left on the vine.
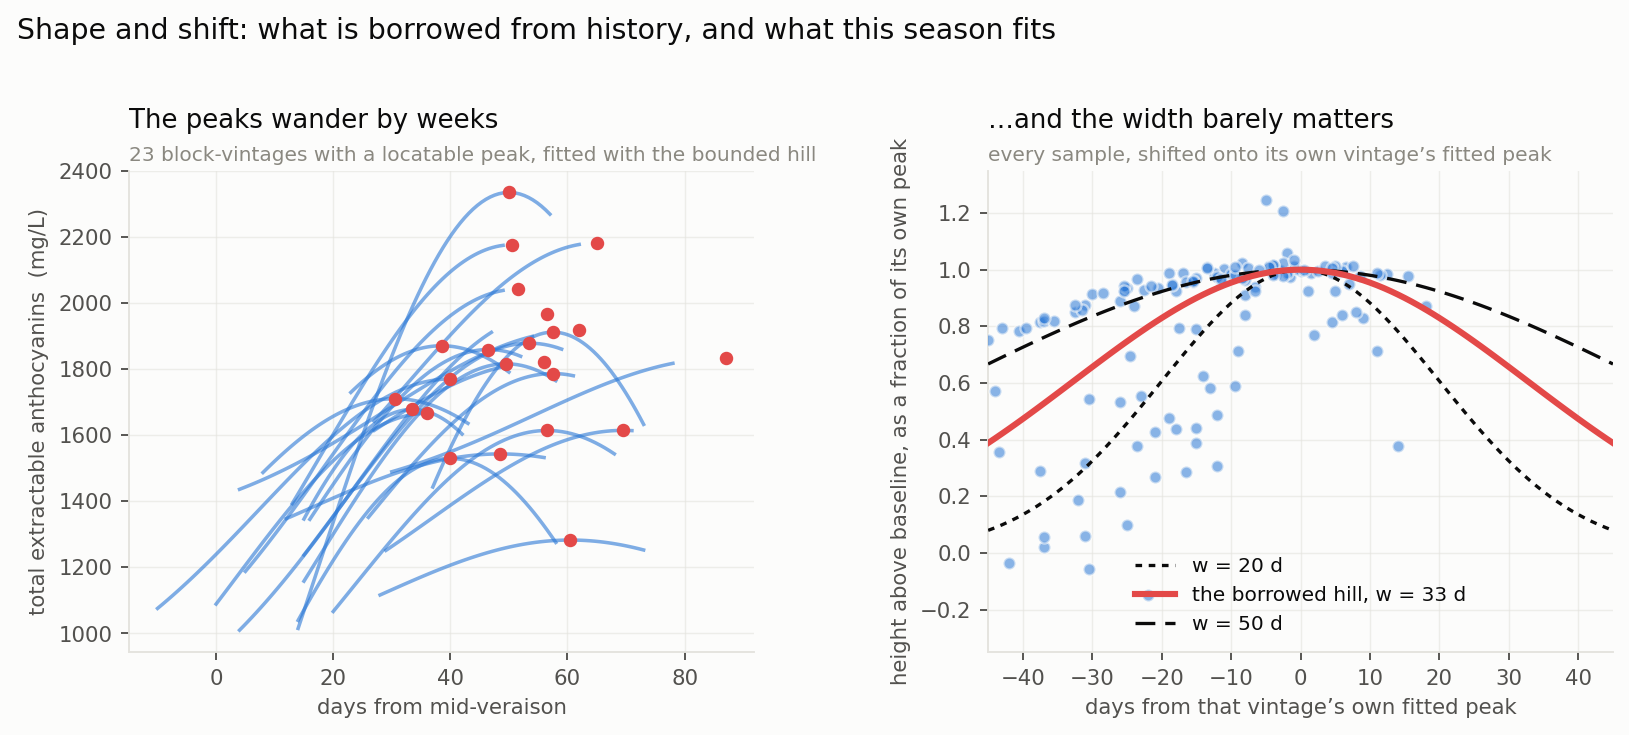
Figure 16. Left: every block-vintage whose sampling caught the crest, on the veraison clock — the dates wander by weeks. Right: the same samples shifted onto their own crest and scaled, against three candidate widths.
The crest date is where shape and shift earn most. The dates wander by weeks between seasons while the shape barely moves, so we fix the width at 33 days and fit only the day. The data does not pin that width—fitted freely per block-vintage, it runs to whichever bound it is given in most cells—and nothing rests on it: across widths from 20 to 60 days, the back-tested crest error moves by less than half a day.
What the Models are Worth
First, the anthocyanin (color) model:
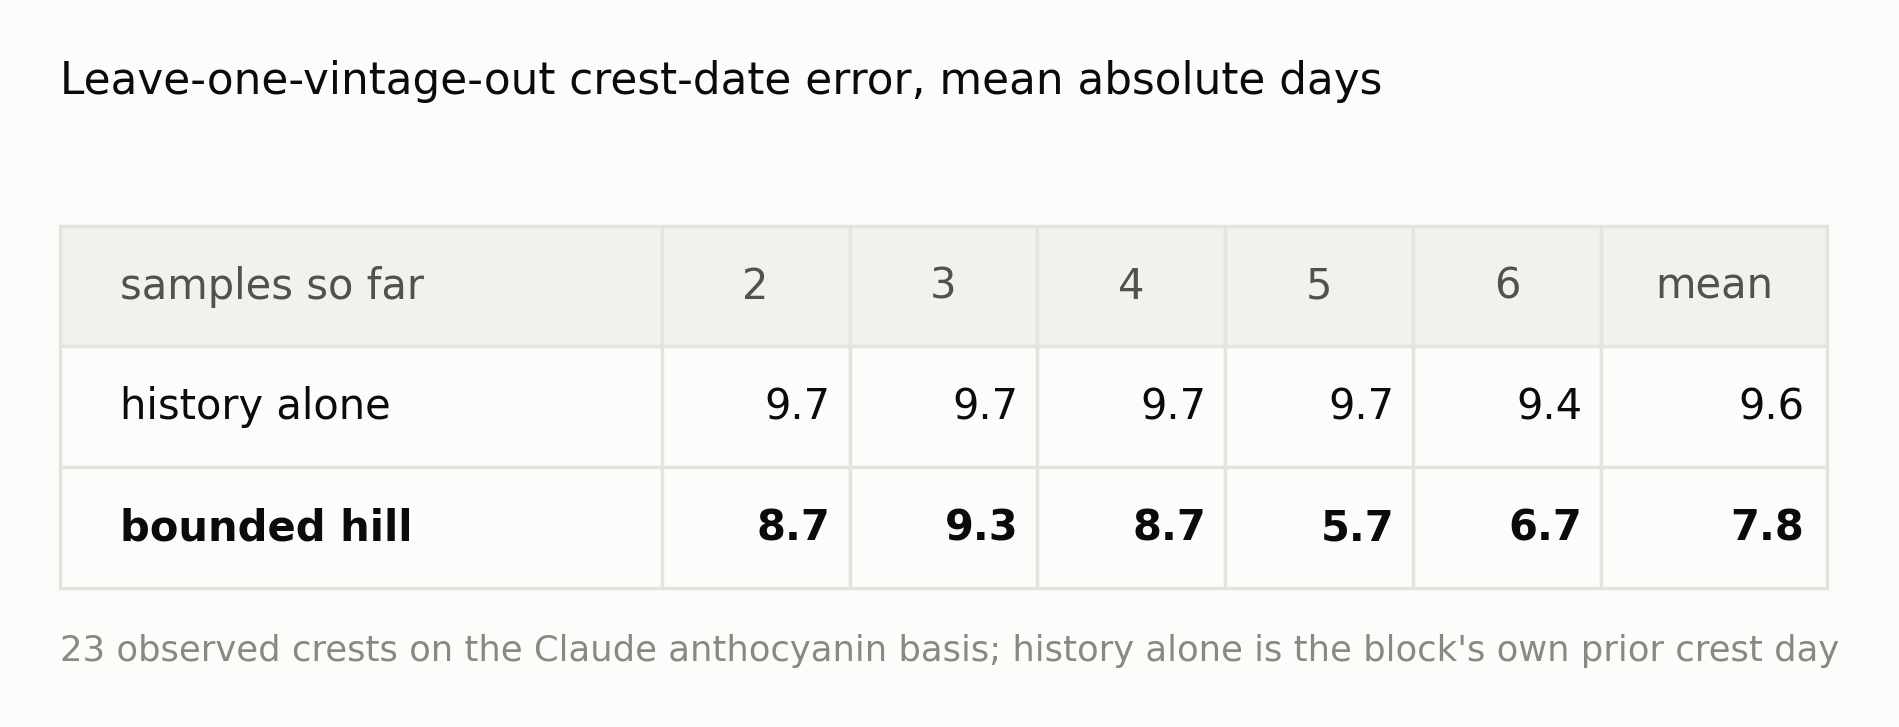
Figure 17. Crest-date error, leave one vintage out, re-predicting each observed crest from only its first n samples. History alone is the block's own prior crest day, which is what we would quote with no samples this season.
Anthocyanins are the weak leg. Measured against the block's own history, the fitted crest earns almost nothing from two or three samples—8.7 days against 9.7—and only pulls clear at five, where the error falls to 5.7 days. Measurement error and real season-to-season variation are similar in size, so most of a season has to be in hand before the samples say more than the history does.
Second, Brix. Projected forward from a partial season it behaves well: roughly half the error of assuming nothing changes, holding out to a month ahead. Fitting its rate against its own level rather than against elapsed days is what makes that work — a 26 % error reduction, and more at long horizons. That is the self-limiting family earning its place rather than a tuning choice.
Third, pH. It projects about as well as Brix at the same horizons, but the Brix clock earns it nothing; fitted on the veraison clock with a knee it does better, which is why the two variables are modeled differently.
Fourth, the acids and berry weight. These are not scored against a harvest decision but against their own later samples, and there the borrowed bend roughly halves the error from three samples (Figure 9).
Underneath it all sits the same limit. The berry sample, not the model, is the binding constraint. At a one-week horizon, the model's own Brix error is smaller than the error in measuring the answer it is checked against, and the model does not become the dominant source of error until about a fortnight out.
What We Have Learned, and What We Have Not
The berry's season has a hinge in it. Four weeks or so after mid-veraison the fruit stops being fed, and five separate measurements register the same event within a few days. We can date that event to about two days from three samples, and after it roughly seven tenths of the Brix rise is water rather than sugar.
The trajectories that describe the fruit need history to work. Borrowing a shape from past seasons and fitting only its position halves the error on the acids and removes the absurd crest dates from the color model. It does so precisely because shape belongs to the site while position belongs to the year.
Four things we cannot claim.
Heat and sugar. Both seasons with heat spells inside the sampling window show less sugar accumulated per berry and more water lost, consistently across blocks, by something like 1.3 to 1.8% a day. But the vineyard has had two such seasons, 2017 and 2022. That is a direction, not a measured effect, and it will stay one until there are more hot Septembers.
A pooled sample is not a berry. Published single-berry work shows one berry completing its sugar rise in about half the time a hundred-berry sample appears to take, except berries don't start together. Every rate in this note is therefore a population rate, roughly 1.4 times slower than a single berry on our own coloring spread. The trajectories describe the block, not the berry.
We have not measured the phloem. We have measured its consequences. Nothing here separates a phloem seal from any other mechanism that stops sugar and water arriving together, and nothing separates transpiration from backflow in the shrinkage afterward.
The bend does not tell us when to pick. It correlates with the pick date at +0.29 and with the color crest at +0.22. It
Prior Art
We checked twenty-two papers against the claims here; the full list, with what could and could not be verified, is in Appendix I. The companion note on weather and vineyard actions carries its own prior art, and five subjects are left there: heat and color, whether anthocyanins crest or climb to the pick, berry-sampling variability, the accuracy of spectral calibrations, and the difference between a hand sample and the must at the crush.
Where it agrees. Parker and colleagues' Grapevine Flowering Veraison model predicts flowering to 5.9 days and veraison to 7.7, and a validation on the VitAdapt collection reports 4.70 to 6.52 days across flowering, veraison and sugar ripeness; the 6.2 and 5.8 days in the appendix sit inside that band. Garcia de Cortazar-Atauri and colleagues found budbreak errors of 9 to 21 days for the standard models and reported that base temperature drove budbreak while the dormancy period did not, which is our chill result in another form. Poni, Sabbatini and Palliotti's review states that mid-winter pruning dates from November to March were ineffective at altering budbreak, and that only pruning past dormancy moves it — our null holds because our window sits inside dormancy. Cameron and colleagues, across 14 vineyards, found that warming shortened the budburst-to-flowering interval while later intervals did not compress, which is the shape of our 2026. Plantevin and colleagues index 51 varieties in weeks after mid-veraison, as we do, and give malic falling 80 to 90 % from veraison to maturity against tartaric's nothing to 30 %.
Where it disagrees. Plantevin reports must pH reaching a plateau at the fifth or sixth week; we find a bend at four weeks after which the climb halves and continues. Van Leeuwen and colleagues decompose ripening speed and find the year accounts for 41 to 45 % of the variance against 5 to 26 % for variety, where our Figure 2 reads as a varietal ordering — their earlier work shows our four varieties need within 4 % of the same heat to reach veraison, so whatever separates our blocks happens after veraison, which is what our anchor assumes. And Wang and colleagues' dynamic anthocyanin model has a degradation rate that rises with date, making the fall steeper than the rise, where our hill is symmetric.
What we did not find published. No study tests chill against budbreak at a warm site and reports a null. No peer-reviewed figure exists for how long a block takes to go from 5 % colored to 95 %. Nothing tracks juice as a fraction of berry weight through a season. And no one appears to have borrowed a shape parameter from past seasons and fitted only the position to the current one, in anthocyanins or in any other grape variable — which is where this method is new, and also where it is most exposed, since it assumes the shape belongs to the site rather than to the year.
Appendix I: Papers checked for Prior Art
Our search in September 2026 found 22 items. Each entry ends with what was actually retrieved — full text, abstract, or title only — and nothing marked title-only is quoted for a number anywhere in the note, followed by a link to the source.
Phenology and thermal time.
1. Parker, Garcia de Cortazar-Atauri, van Leeuwen & Chuine (2011), Aust J Grape Wine Res 17:206–216. The Grapevine Flowering Veraison model: base 0 °C from day 60, RMSE 5.9 days for flowering and 7.7 for veraison. Bears on our thermal-time result, and agrees. Full text of the conference version. doi.org/10.1111/j.1755-0238.2011.00140.x
2. Wang, Li & Garcia de Cortazar-Atauri (2018), Vitis 57:9–16. Per-cultivar thresholds, and the model transplanted to China loses badly — RMSE over 10 days and negative model efficiency for flowering. Bears on transferability, and marks its limits. Abstract and parameter table. doi.org/10.5073/vitis.2018.57.9-16
3. Parker, Garcia de Cortazar-Atauri and colleagues (2020), Agric For Meteorol. The Grapevine Sugar Ripeness model: base 0 °C from day 91 across 65 cultivars; beat the flowering-veraison model and both Winkler and Huglin at every sugar target. Sits in tension with our finding that the calendar wins by harvest. Full text. doi.org/10.1016/j.agrformet.2020.107902
4. Parker, Garcia de Cortazar-Atauri, Trought, Destrac, Agnew, Sturman & van Leeuwen (2020), OENO One 54(4):955–974, XIII International Terroir Congress. Both models on the VitAdapt collection: 4.70 days for flowering, 5.07 for veraison and 6.52 for sugar ripeness. Our 6.2 and 5.8 days sit inside that band. Abstract and model parameters. doi.org/10.20870/oeno-one.2020.54.4.3861
5. van Leeuwen, Garnier, Agut and colleagues (2008), VII International Terroir Congress. Heat requirement to veraison, base 10 °C, for the four varieties we grow: they sit within a few per cent of each other, which is what refines our block-as-property result. The per-variety figures are given in a bar chart rather than a table and cannot be read off it reliably, so none is quoted here. Full text; the varietal degree-day figures are not verifiable from the published figure. ives-openscience.eu/9378
6. Garcia de Cortazar-Atauri, Brisson & Gaudillere (2009), Int J Biometeorol 53:317–326. Budburst errors of 9 to 21 days for the standard models; base temperature was the main driver and the dormancy period was not significant. Agrees with our 7.5-day budbreak error and our chill null. Abstract. doi.org/10.1007/s00484-009-0217-4
7. Camargo-Alvarez, Salazar-Gutierrez, Keller & Hoogenboom (2020), Agric For Meteorol 280:107782. Chilling is quantifiable and Cabernet Sauvignon has a longer endodormancy than Chardonnay. Partly disagrees with our chill null and makes it site-specific. Abstract; a reported chilling-unit figure was not confirmed and is not used. doi.org/10.1016/j.agrformet.2019.107782
8. Poni, Sabbatini & Palliotti (2022), Am J Enol Vitic 73(4):211–226. Mid-winter pruning from November to March does not alter budbreak; pruning past dormancy delays it 5 to 56 days. Agrees with our pruning null of r = +0.01. Full text. doi.org/10.5344/ajev.2022.22011
9. Cameron, Petrie, Barlow, Howell, Jarvis & Fuentes (2021), Aust J Grape Wine Res. Across 14 vineyards, only the budburst-to-flowering interval shortened significantly with warming. That is the shape of our 2026. Abstract. doi.org/10.1111/ajgw.12481
Veraison as a spread event.
10. Shahood, Torregrosa, Savoi & Romieu (2020), OENO One 54(4):1077–1092. Two to three thousand single berries: the heterogeneity is mostly time lags in the onset of sugar storage, and malate is oxidised in the first two weeks and then stops. Agrees with our veraison spread and refines the malic trajectory. Full text. doi.org/10.20870/oeno-one.2020.54.4.3787
11. Tavernier and colleagues (2025), Quantitative Plant Biology 6. A single berry takes about 20 days to go from 0.2 to 1.0 M sugar against the ~45 days a pooled sample appears to take; asynchrony causes a twofold underestimate of the rate. This is the basis of our pooled-sample caveat. Full text. doi.org/10.1017/qpb.2025.10025
12. Gouthu & Deluc (2015), BMC Plant Biology. At mid-veraison, green-hard berries run about 14 days behind red berries in the same cluster. Agrees by analogy with our 19 ± 6 day block spread. Abstract. doi.org/10.1186/s12870-015-0440-6
13. Vondras, Gouthu, Schmidt, Petersen & Deluc (2016), Planta. Seed content, not flowering time, is linked to uneven ripening initiation — so the spread is not an artefact of flowering date. Abstract. doi.org/10.1007/s00425-016-2474-x
The clock, trajectory fitting and in-season forecasting.
14. van Leeuwen, Destrac-Irvine, Gowdy, Farris, Pieri, Marolleau & Gambetta (2023), OENO One 57(2), 22nd GiESCO. Sugar-to-acid against thermal summation, R² 0.98 to 1.00 over four weeks after veraison; ripening-speed variance is 41 to 45 % year, 5 to 26 % variety, 14 % soil. Every parameter is re-fitted per season, which is where our borrowed shape has no precedent. Full text. doi.org/10.20870/oeno-one.2023.57.2.7399
15. Meggio (2022), OENO One 56(1), Terclim. Four cultivars over 2009 to 2021: three-parameter logistic for sugar and pH, a two-parameter exponential for titratable acidity, fitted on day-of-year with separate parameters per year and cultivar. Agrees on Brix deceleration and the acid shape, disagrees on linear pH. Full text. doi.org/10.20870/oeno-one.2022.56.1.4727
16. de Resseguier, Inchboard, Parker, Petitjean & van Leeuwen (2024), OENO One 58(4). Merlot across 18 Bordeaux sites over seven years, a sigmoid for sugar; veraison to 95 % of maximum sugar ranged 21 to 52 days, and one degree of warming advanced that date by 4.1 days. Agrees with our veraison-anchored interval. Abstract and results. doi.org/10.20870/oeno-one.2024.58.4.8195
17. Wang and colleagues (2023), Annals of Botany 132(5):1033. A dynamic anthocyanin model of 15 coupled differential equations whose degradation rate rises with date, so the fall is steeper than the rise. Refines — and disagrees with — the symmetry of our bounded hill. Full text. doi.org/10.1093/aob/mcad165
Acids, pH and nitrogen.
18. Plantevin and colleagues (2024), Front Plant Sci 15:1439114. Fifty-one varieties over seven vintages, indexed in weeks after mid-veraison as we do: malic falls 80 to 90 % from veraison to maturity against tartaric's nothing to 30 %, and must pH plateaus at week five or six. Agrees on the clock and the acids; disagrees on the pH plateau. Full text. doi.org/10.3389/fpls.2024.1439114
19. Kliewer, Howarth & Omori (1967), Am J Enol Vitic 18(1):42–54. Free tartrate falls from 23 % to 11 % of total tartrates while free malate falls from 45 % to 27 %. The classical version of tartaric being the stable one. Abstract. doi.org/10.5344/ajev.1967.18.1.42
20. Boulton (1980), Am J Enol Vitic 31(2):182–186. pH as a function of titratable acidity, potassium, sodium and the tartrate-to-malate ratio. Refines why pH behaves more cleanly than titratable acidity. Abstract only; cited qualitatively, no coefficients taken. doi.org/10.5344/ajev.1980.31.2.182
21. Sweetman, Deluc, Cramer, Ford & Soole (2009), Phytochemistry. A review of malate metabolism in ripening fruit. Title and citation only — not cited for anything in the note. doi.org/10.1016/j.phytochem.2009.08.006
22. Bouloumpasi, Skendi & Soufleros (2023), Fermentation 9(8):773. Two hundred and seventy-four musts with an eight-fold spread in yeast-assimilable nitrogen, 40 to 332 mg N/L, and high within-variety variance. Agrees with our finding that nitrogen will not support a trajectory. Full text. doi.org/10.3390/fermentation9080773
Searched for and not found. Chill hours against budbreak at a warm site reported as a null; a block's 5 % to 95 % coloring window; and juice as a fraction of berry weight through a season. The nearest thing to the first is item 6; the literature answers the second at the level of the single berry rather than the block, in items 10 to 13.
Appendix II: The Season Before the Berries
The berries exist because of what happened earlier in the year, and the dates of those earlier events move by weeks between seasons. None of it is needed to read the models above; it is what fixes the day the veraison clock starts.
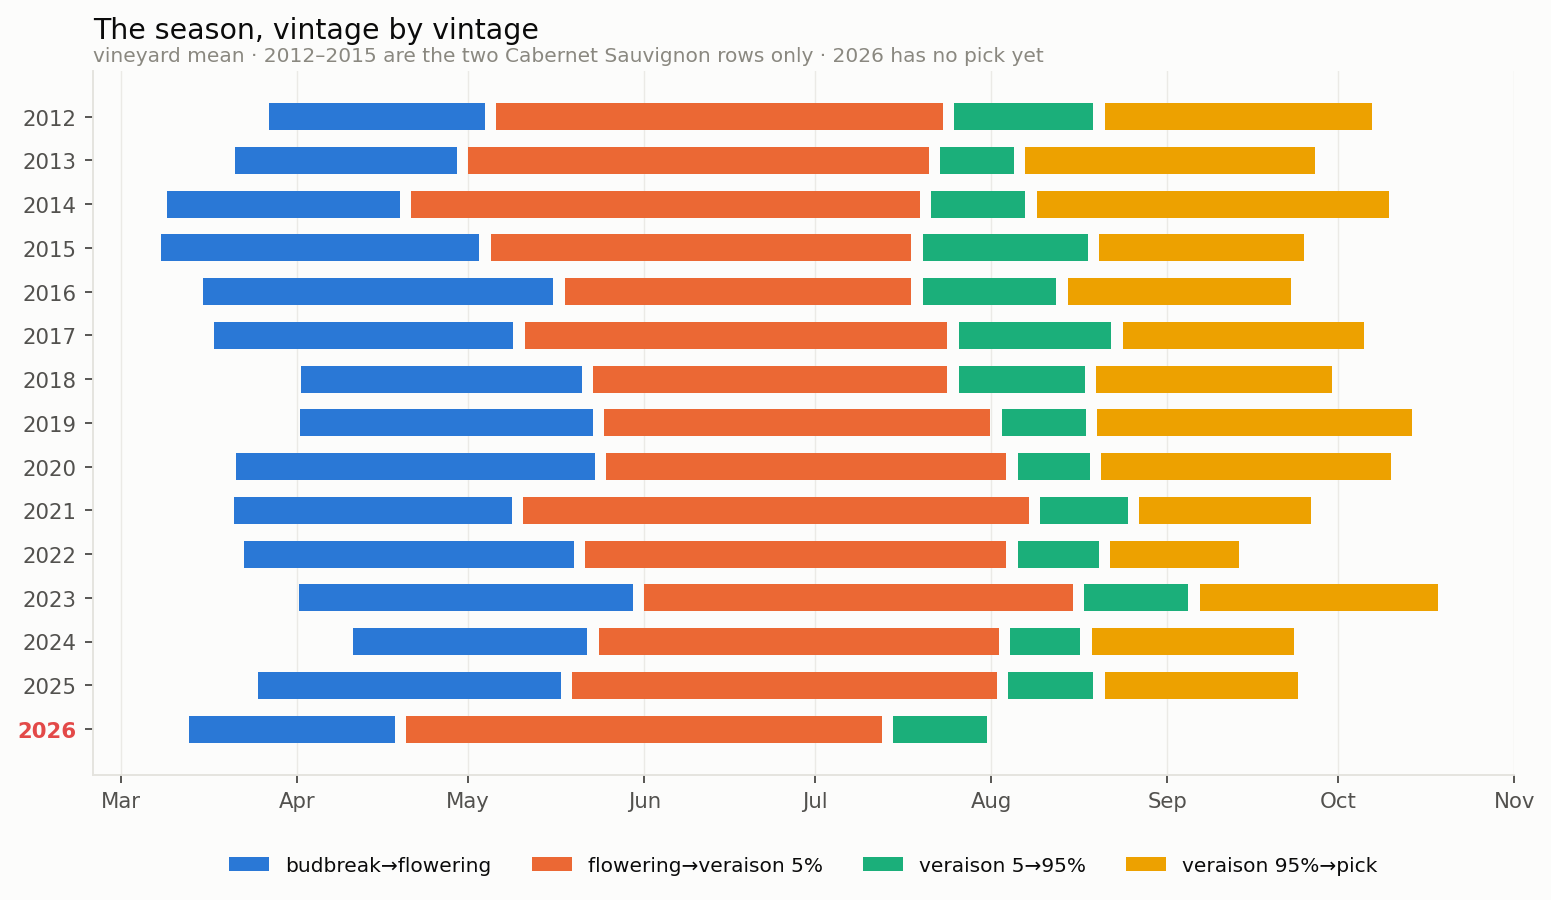
Figure A1. The four stages on one calendar, vintage by vintage. Vineyard mean; 2012 to 2015 are the two Cabernet Sauvignon rows only.
From budbreak to the pick takes 191 ± 16 days. The stages inside it stay in proportion even as the whole season slides five or six weeks on the calendar: 54 ± 9 days budbreak to flowering, 84 ± 11 flowering to mid-veraison, 52 ± 15 mid-veraison to pick.
What sets the dates is heat, not the calendar. Our yardstick is growing degree-days, described in the companion note.
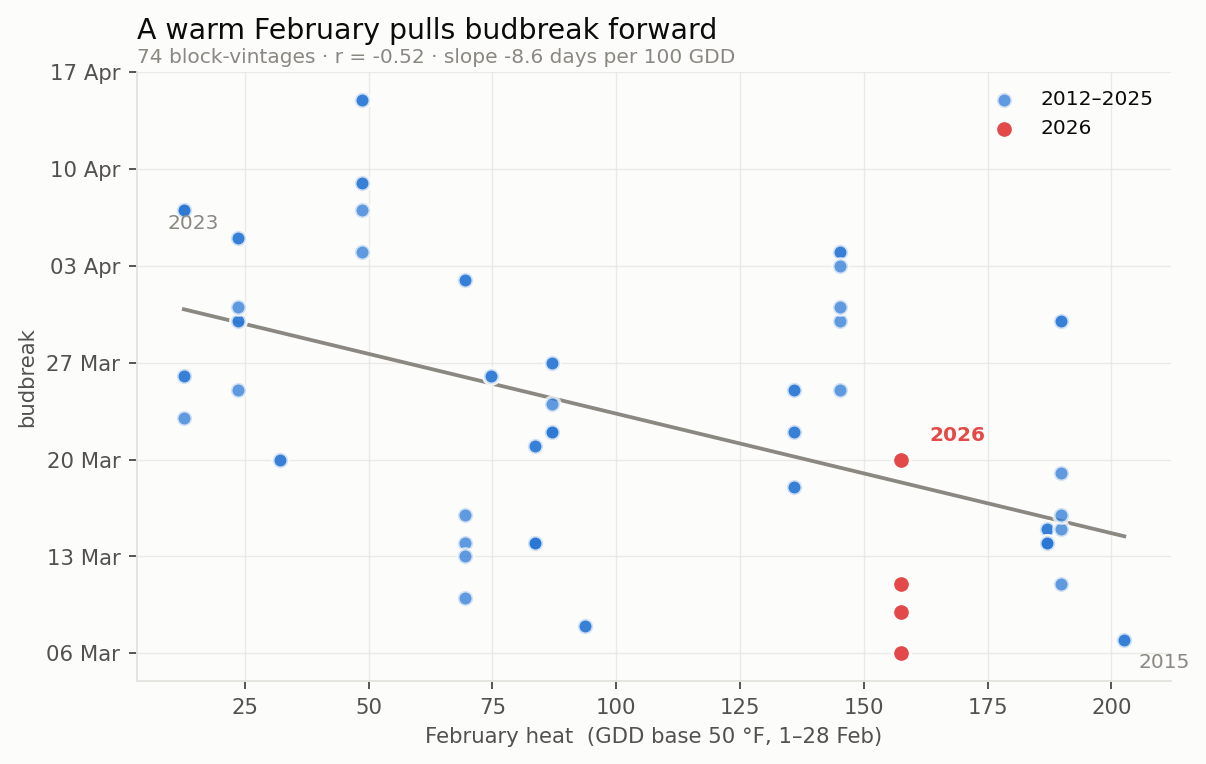
Figure A2. Budbreak comes earlier after a warm February. Each dot is one block-vintage.
Growing degree-days over the first 28 days of February predict budbreak at r = −0.52 across 74 block-vintages, roughly nine days earlier per 100 degree-days. Leaving one vintage out, heat predicts budbreak to 7.5 days against 9.0 for the calendar. February ends before the earliest budbreak we have recorded, March 7 2015, so the prediction uses only days that have already happened.
Flowering and mid-veraison are thermal-time events measured from budbreak, and heat beats the calendar at both: 6.2 days against 10.2 for flowering, 5.8 against 6.7 for mid-veraison. The margin narrows as the season goes on.
Two things do not set the dates. Chill does not predict budbreak here — over fourteen winters chill hours average 567 with an enormous spread, 202 in 2015 against 945 in 2023, and the correlation with budbreak is +0.23. This is a warm site, and whatever chill requirement these varieties have is met every year. Nor does pruning date: comparing blocks within a season, which removes the weather, and removing block identity as well, what remains is r = +0.01. Pruning date may matter elsewhere; across the six weeks we prune over, any effect is smaller than the data can resolve.
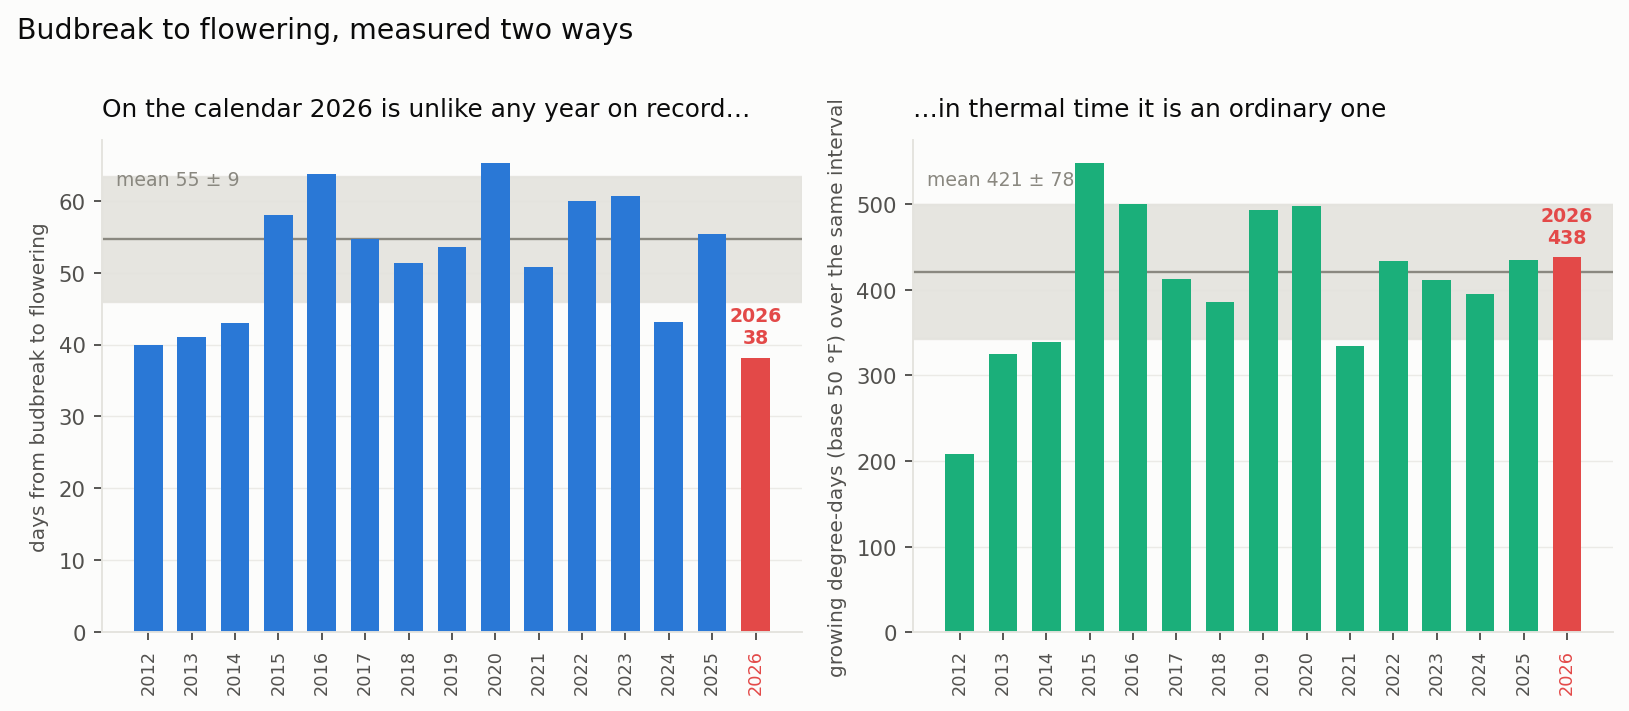
Figure A3. 2026 took 38 days from budbreak to flowering against a norm of 55, and an entirely ordinary 438 degree-days.
2026 is the demonstration. It is the earliest season on record at every stage, and budbreak to flowering took 38 days against a norm of 55 ± 9 — nearly two standard deviations short, unlike anything else in the record. In thermal time it is unremarkable: 438 degree-days against 421 ± 78. March 2026 accumulated 356 growing degree-days against a fourteen-year mean of 133, the warmest March on record, while January, April and May were ordinary. The vine did the usual thing at the speed the heat allowed.
Draft 11, October 1, 2026
Here is the pdf file of this section 2026-10-01 Modeling Berry Maturation draft 11