Modeling the Fermentation
This page describes the models we built to turn nearly 12,000 values recorded during 50 fermentations into something more useful: a compact mathematical fingerprint of how each fermentation unfolded.
When the grape must reaches the fermentation tank, a two- to three-week scramble begins. Yeast converts sugar into alcohol; color and tannin migrate out of the skins and seeds into the juice; and the acid balance shifts. We record all of this activity by sampling each fermenting batch every day. The result is a thicket of numbers—for a single ferment, a dozen quantities, each measured a dozen or more times.
The model's job is to replace that pile of measurements with one smooth curve for each quantity and a few numbers that describe it: when color peaked, how fast the sugar fell, how much tannin we ended up with. Once we summarized every fermentation the same way, we can compare vintages on an equal footing, flag a batch that is behaving oddly while we can still do something about it, and predict where a ferment is heading from its first few days. We call these curves trajectories, and the collection of them a kinetic model — kinetic because it is about rates, about how fast things happen.
We structured this note into 5 sections:
The Data: We start by describing what we recorded, our pile of measurements.
Transforming the Measurements: We explain how we read the spectra and results from our OenoFoss analyzer during fermentation.
Trajectories: We fit the trajectories on the improved measurements to build the kinetic model.
Acidity and Tartaric Acid Additions: Tartaric acid additions are external interventions which alter acid trajectories.
Using the Model: The trajectories allow us not only to project their probable outcome before a fermentation is finished, but also to compare fermentations across vintages and varietals.
We conclude with Prior Art, a review of published research that identifies what supports our insights, what does not, and what aspects of our analysis appear novel.
The Data
Our fermentation records start with the 2013 vintage. Since then, we have fermented 50 batches with enough data to model: 24 Cabernet Sauvignon, 12 Merlot, and 14 blends. Together, they include nearly 12,000 recorded measurements.
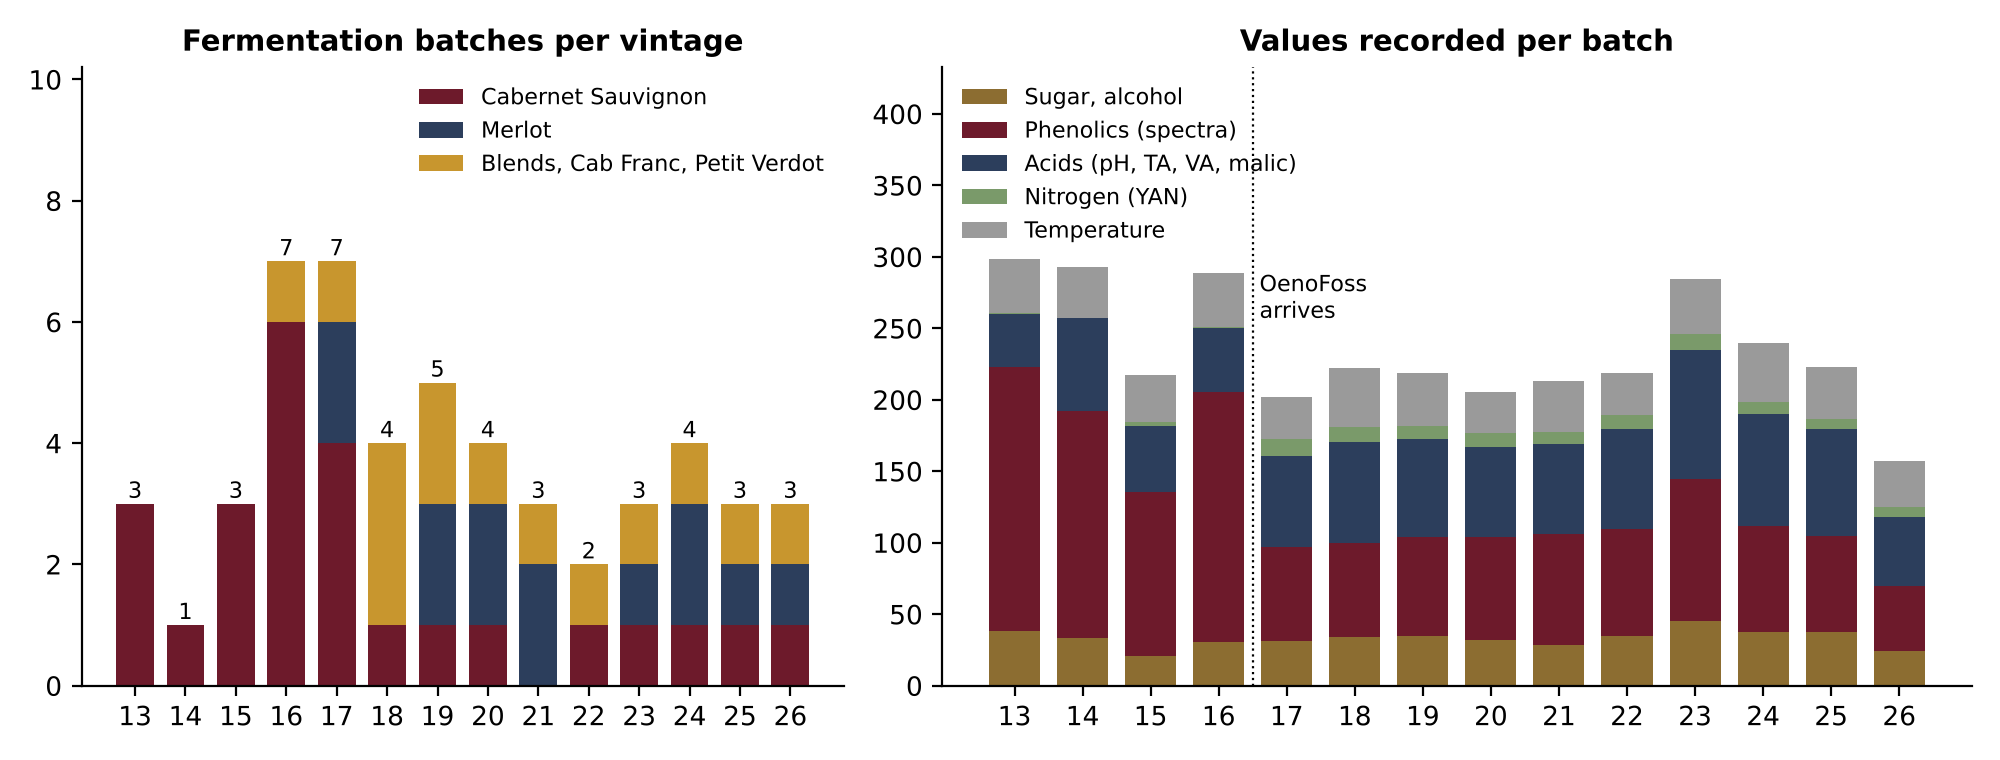
Figure 1. Left: the 50 fermentation batches by vintage and grape. Right: values recorded per batch, per vintage, by kind. The dotted line marks the arrival of the OenoFoss analyzer in 2017.
Per batch, we recorded more values before 2017 than after—about 280 versus 220—and the difference is in the spectra: 163 phenolic values per batch before, 70 after. The acid record goes the other way, from 45 values per batch to 69.
Sugar and alcohol (~1,700 values) — sugar as Brix, falling as the yeast consumes it; alcohol rising as the sugar disappears.
Phenolics (~1,000 spectra yielding ~5,000 values) — free, bound, and total anthocyanins (the red pigments), tannins, and total iron-reactive phenolics, all estimated from a spectrum of each sample.
Acids (>3,000 measurements) — total acidity (TA), pH, volatile acidity, and malic acid.
Nitrogen (>700 measurements) — yeast-assimilable nitrogen (alpha amino acids and ammonia), the yeast's food.
Temperature (~ 1,800 recordings) — read at every sampling and in between, which turns out to matter more than anything else.
Until 2016, the acids came from a wet laboratory: pH often, total acidity now and then, volatile and malic acid rarely. In 2017, we bought an OenoFoss analyzer that measures sugar, alcohol, density, acids, and nitrogen from a one-milliliter sample in two minutes. Since then, we've measured all four acids with every sample, about 18 readings per batch. The analyzer also introduced a measurement problem we had to address first.
Transforming the Measurements
We measure phenolic properties by taking a 700-point spectrum of a sample and estimating the phenolic properties from that spectrum: free, bound, and total anthocyanins (the red pigments), tannins, and total iron-reactive phenolics. A companion note explains this transformation (link).
For all other measurements, except temperature, we use OenoFoss, which reads an infrared spectrum and converts it into estimates of chemical properties. FOSS supplies two sets of calibrated measurements: one for unfermented juice and must (Must), and one for finished wine (FinW). A third set, Must under Fermentation (MUF), is not calibrated at all. So, we read every sample in up to three modes, and none of them is in the middle of fermentation [8, 9]. Calibration during a fermentation is challenging because the sample's characteristics change constantly (fermentation is a relatively fast process).
The remainder of this section describes how we quasi-calibrate the third set with our own data to obtain more accurate measurements. For our proxy-calibration, we make 3 assumptions:
Assumption 1: The MUF measurements at the very beginning of the fermentation (up to 2% completion) are consistent, i.e., they differ from the Must measurements by a consistent amount that we can estimate.
Assumption 2: MUF measurements near the end of fermentation (above 95% completion) are also consistent; they differ from the FinW measurement by a consistent, estimable amount.
Assumption 3a: We can estimate the calibration adjustments in between (from 2% completion to 95% completion) as a weighted sum of the initial and end adjustment weighted by their respective completion distance.
We estimate the initial and end adjustments for Assumptions 1 & 2 by examining the observed differences between Must-MUF and MUF-FinW across all measurements. Figure 2 shows these differences for the Total Acidity measurements across all batches:
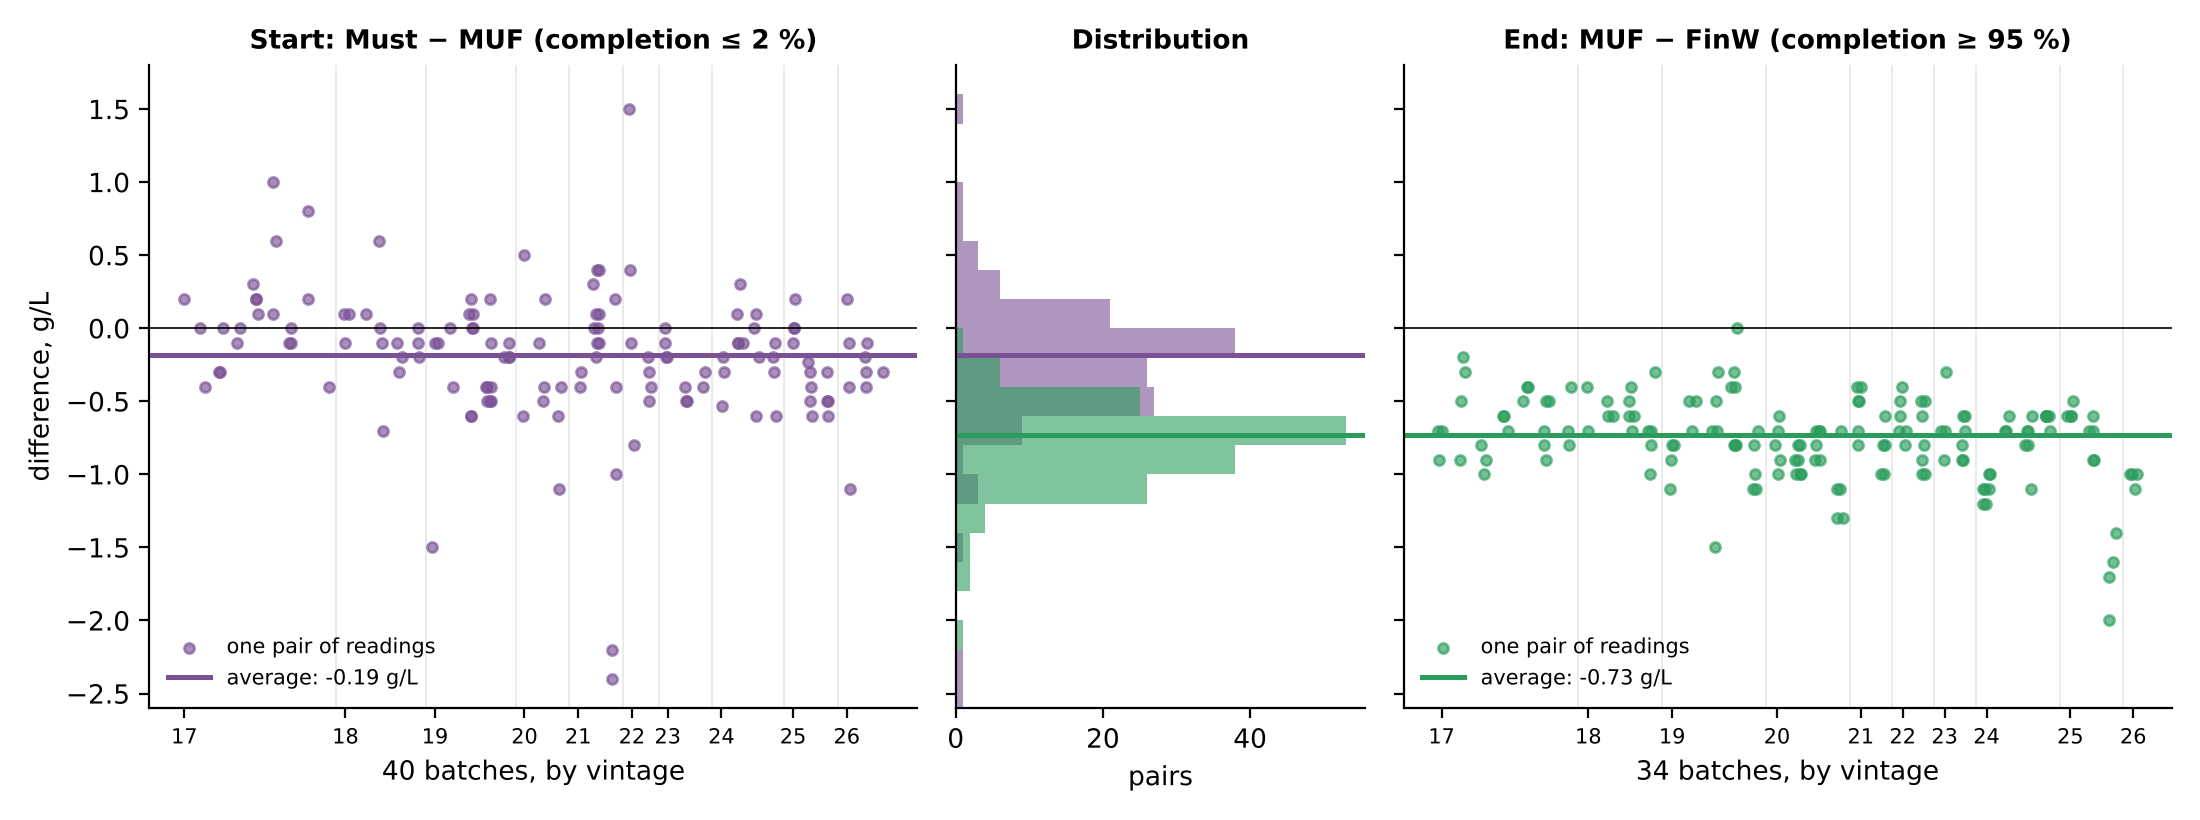
Figure 2. Every pair of TA readings taken on the same sample. Left: Must minus MUF before 2 % completion. Right: MUF minus FinW after 95 %. Dots are single pairs; lines are the averages across all batches. Middle: the distribution of both, on the same scale.
At the start of fermentation, our database has 140 pairs from 40 batches; Must reads, on average, 0.19 g/L below MUF. At the end, we have 159 pairs from 34 batches; MUF reads, on average, 0.73 g/L below FinW.
Figure 3 (left) shows the offsets and linear interpolation between 2% and 95% completion for TA in the 2023 Cabernet Sauvignon batch.
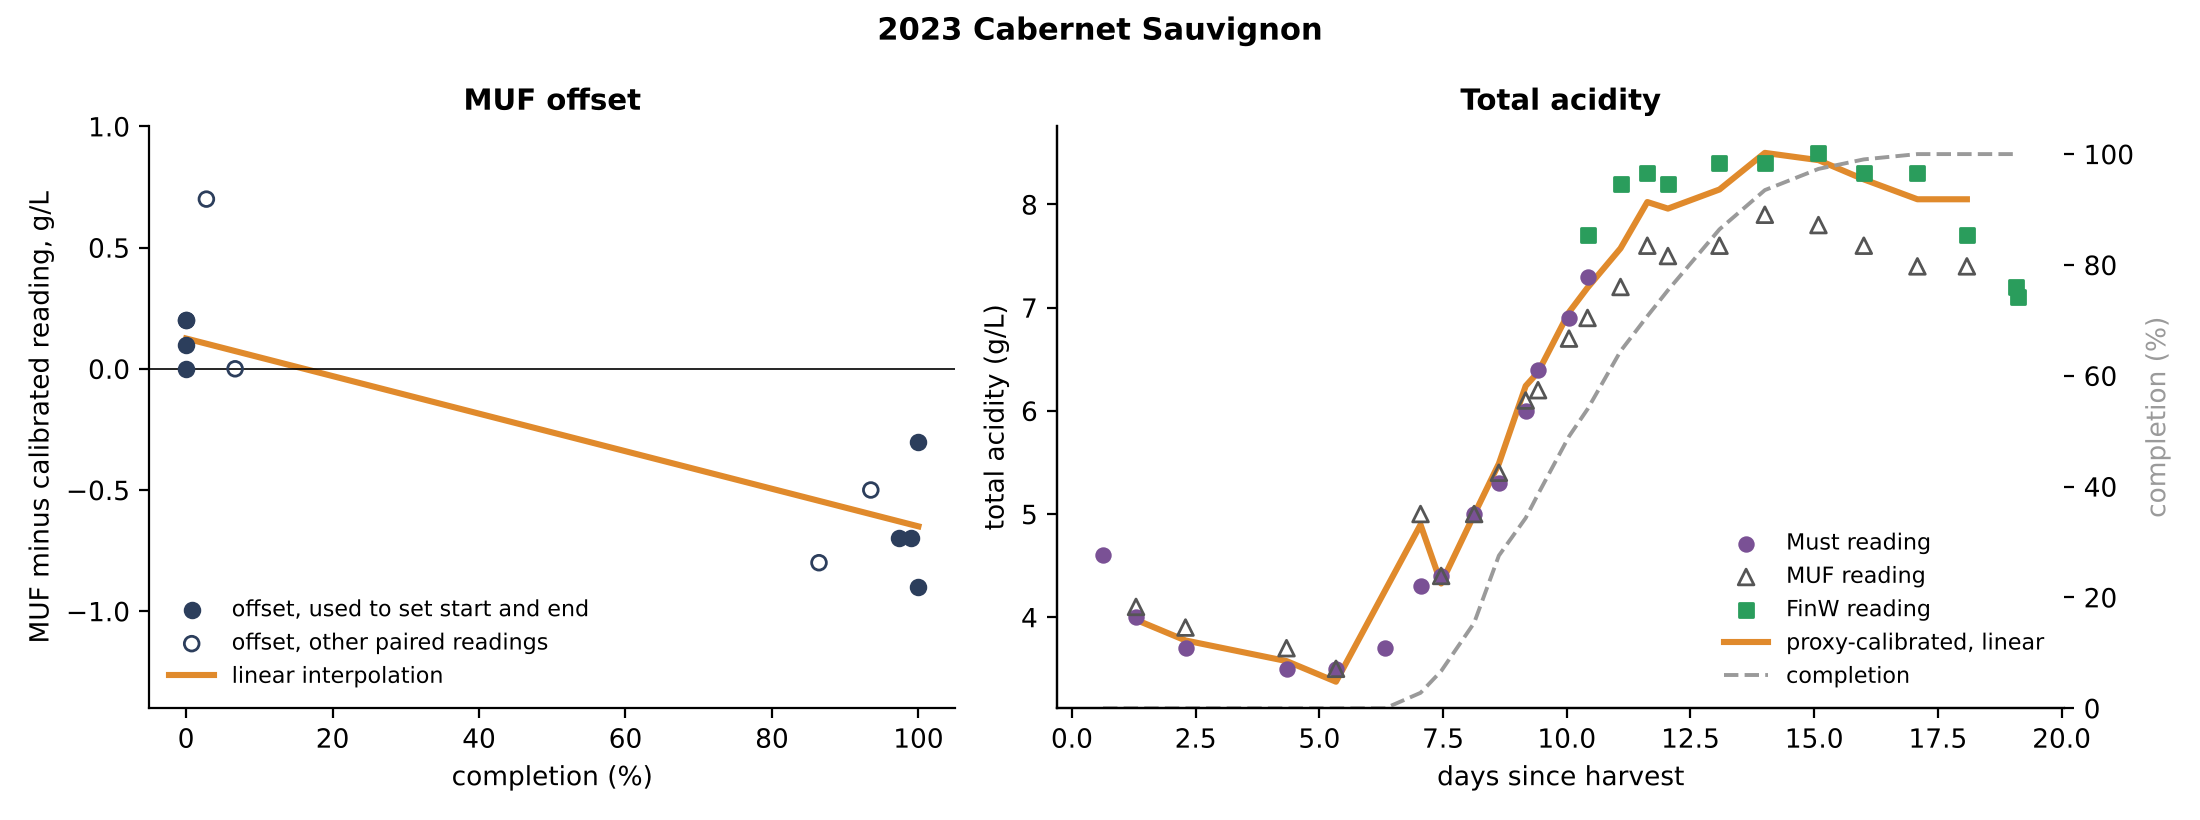
Figure 3. Total acidity in the 2023 Cabernet Sauvignon. Left: MUF minus the calibrated reading on the same sample. Filled dots mark the start and end offsets; open dots are paired readings at 2- 15% and 80- 95% completion. Orange: the linear interpolation between the two offsets. Right: the readings in all three modes, the linear proxy-calibrated estimate (orange), and % completion (gray, right axis).
Figure 3 on the right shows Must, MUF, and FinW TA measurements for the same batch and the Proxy-calibrated trajectory, using the beginning and end offsets and linear interpolation in between.
We took Must and MUF readings for every sample until the middle of fermentation, and FinW readings from then on. Completion — computed from density — stays at zero through the six-day cold soak, climbs from day 7, and passes 95 % on day 15. Before fermentation, the Must and MUF readings agree within 0.2 g/L. By the end, they part ways: once the wine is dry, MUF reads 0.3 to 0.9 g/L below FinW, averaging 0.65. Acidity itself climbs from 3.5 to 8.5 g/L during the fermentation and falls back to 7.2 by pressing. The linear estimate starts at the Must readings and ends at the FinW readings; late in fermentation, before the wine is dry, it runs up to 0.3 g/L below the FinW readings.
Now we modify Assumption 3:
Assumption 3b: Between 2 % and 95 % completion, the adjustment is the linear interpolation of Assumption 3a plus a correction which depends only on % completion and is the same for every batch.
Assumption 3a can be checked wherever a calibrated reading exists. Early in the fermentation, up to 15% completion, little alcohol has formed, and the Must reading is still quasi-calibrated; later, above 80% completion, little sugar remains, so the FinW readings are also OK. The check: In the 2023 Cabernet Sauvignon, the paired readings in those ranges (open circles in Figure 3) do not sit on the interpolated line. Across all batches, they consistently fall below it by about 0.3 g/L from 5% to 85% completion (Figure 4, left). The linear interpolation therefore leaves a systematic error in the middle of every fermentation, and the same error in every batch.
To remove it, we build a correction curve in four steps:
For each sample in the two ranges, we take its measured offset—MUF minus the quasi-calibrated reading—and subtract the linear interpolation for its batch.
We pool these differences across all batches and take the median in narrow completion bands centered on 5%, 15%, 85%, and 93%. At 0% and 100%, the curve is zero because the start and end offsets already apply.
Between 15% and 80%, no calibrated reading exists; the curve runs linearly between its two ends.
We add the curve to every batch's linear interpolation.
Figure 4, left, shows the additional adjustment to the linear interpolation and the individual differences observed across all TA measurements.
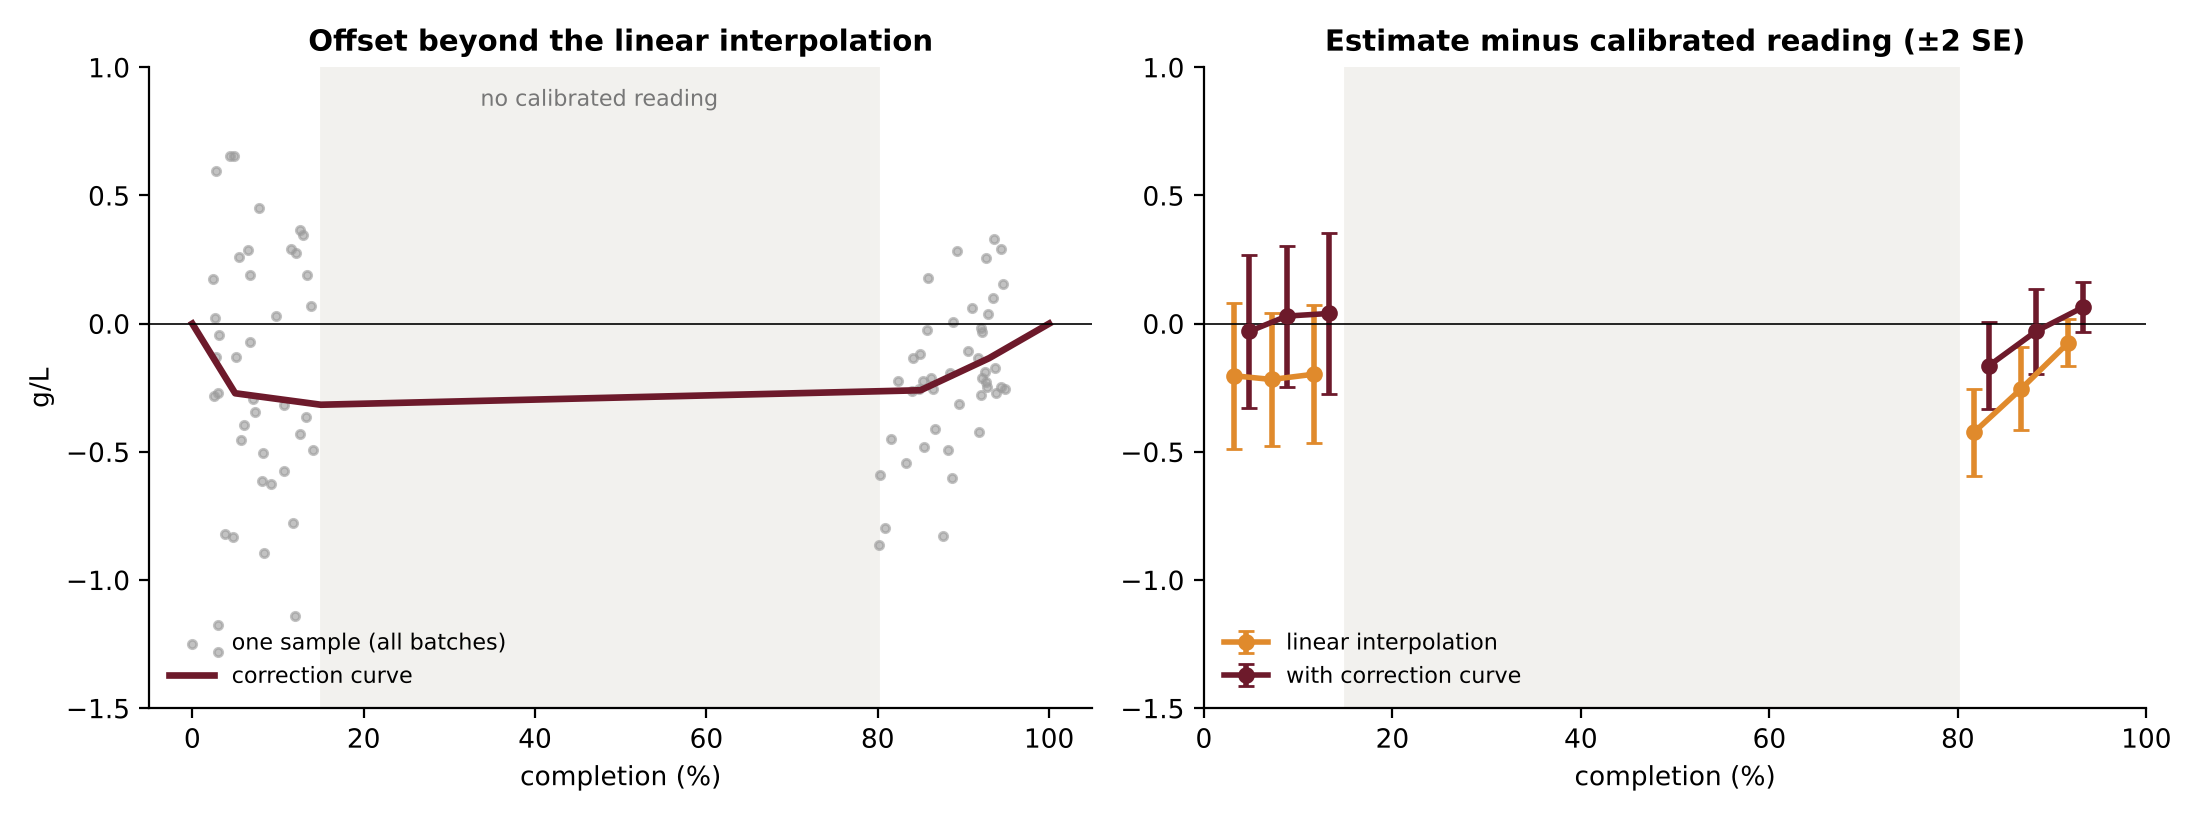
Figure 4. Total acidity, all batches. Left: offset beyond the linear interpolation for every sample with a quasi-calibrated reading, and the correction curve. Right: estimate minus calibrated reading by completion band (±2 SE), each batch left out of the fitting in turn — linear interpolation alone and with the correction curve. Both panels share one scale.
Figure 4. Total acidity, all batches. Left: offset beyond the linear interpolation for every sample with a quasi-calibrated reading, and the correction curve. Right: estimate minus calibrated reading by completion band (±2 SE), each batch left out of the fitting in turn — linear interpolation alone and with the correction curve. Both panels share one scale.
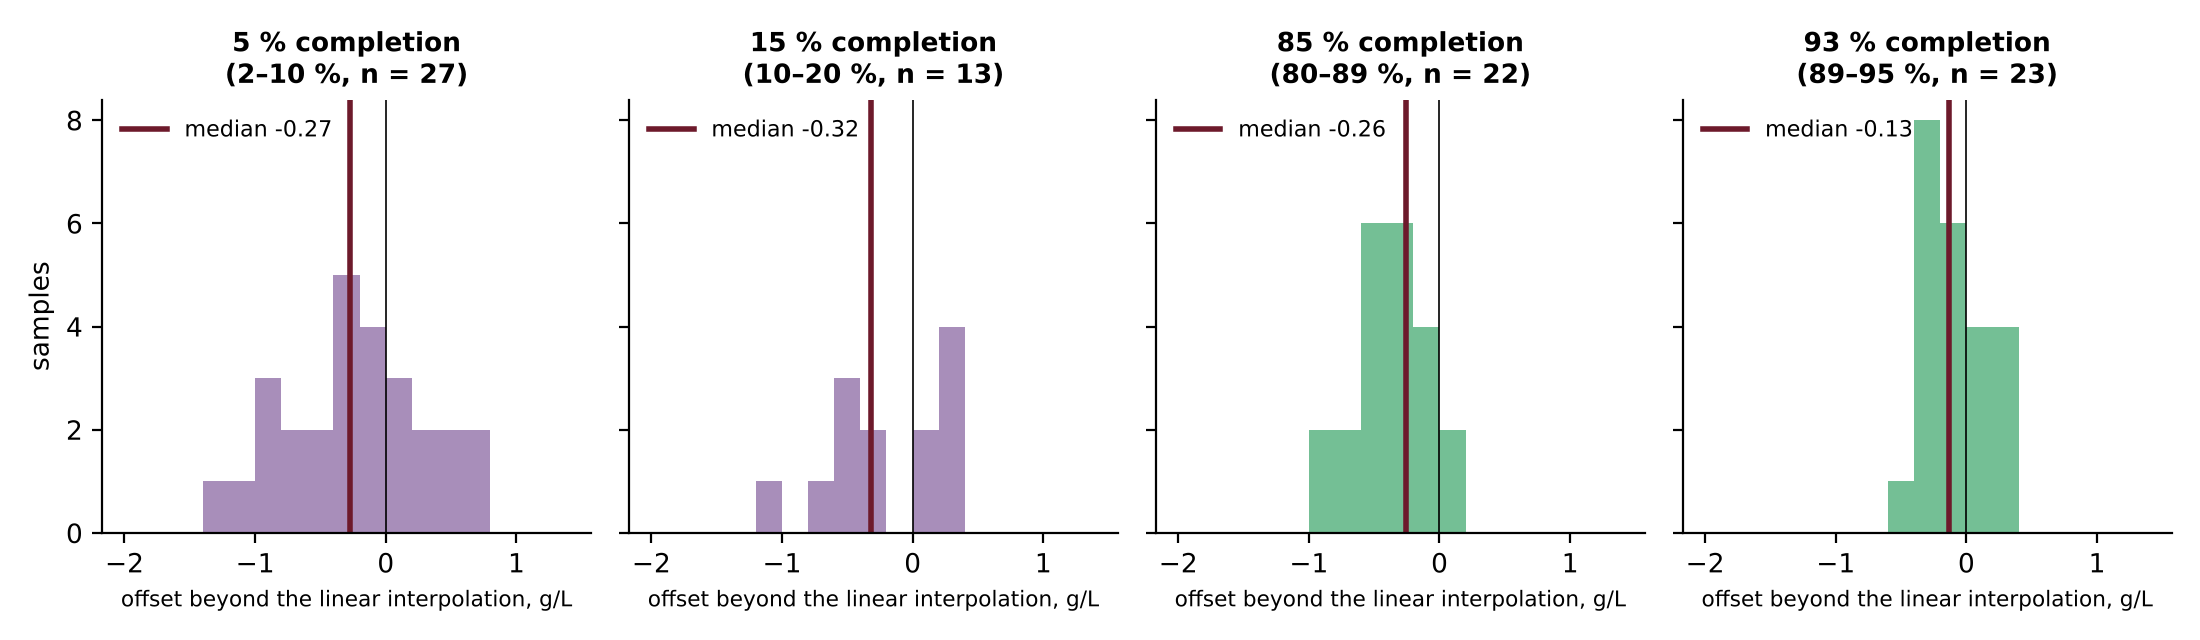
Figure 5. Total acidity, all batches: the differences of step 1 in the four completion bands that set the correction curve, and their medians.
Figure 5 shows the differences behind steps 1 and 2 band by band. Single samples scatter widely, but the medians agree: −0.27 and −0.32 g/L in the two early bands, −0.26 g/L at 85%, and −0.13 g/L at 93%, closing toward zero as the wine approaches dry.
The same procedure gives each acid its own curve. pH reads up to 0.19 low, total acidity about 0.3 g/L low through most of the fermentation, volatile acidity a few hundredths, and malic acid swings to 0.5 g/L low near 85 %. The start and end offsets also differ by acid: at the finish, MUF reads total acidity 0.73 g/L lower than FinW and malic acid 1.98 g/L higher.
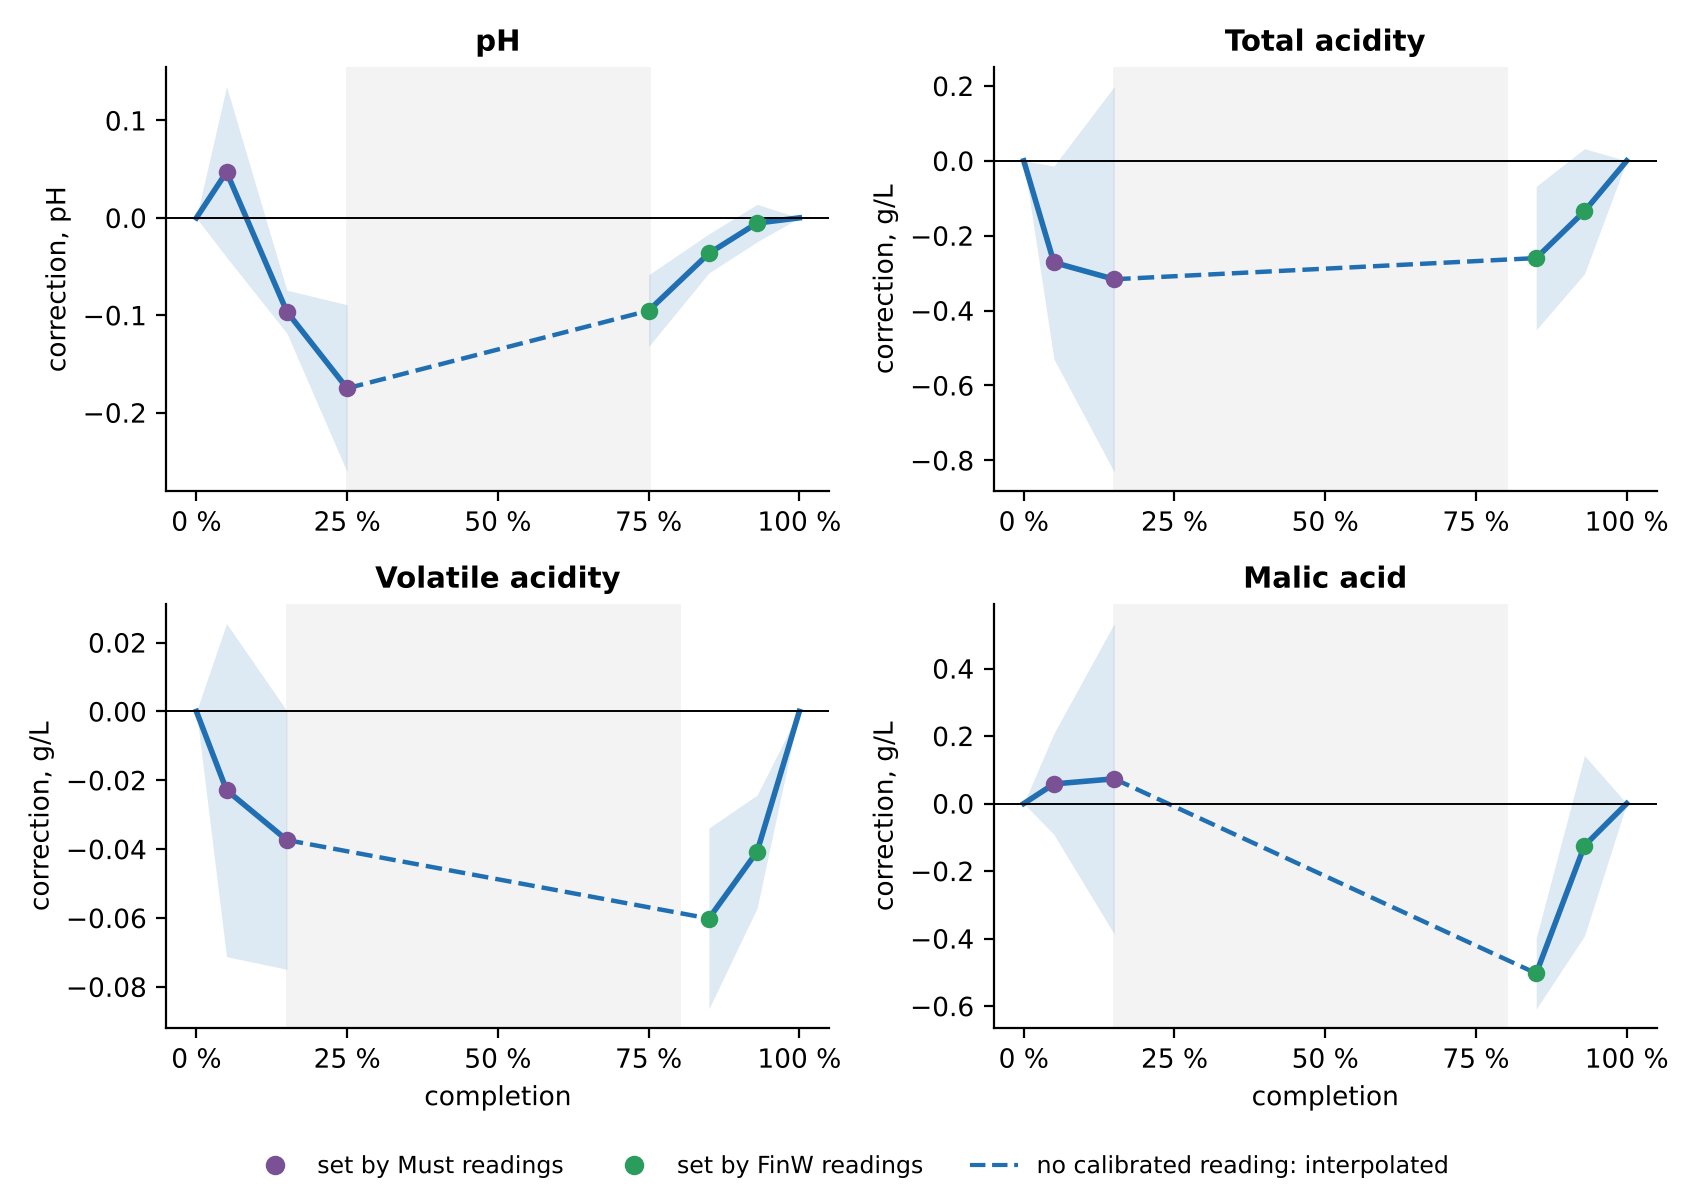
Figure 6. The correction curve for each acid. Purple points are set by the Must readings; green points are set by the FinW readings. Across the shaded middle, we interpolate the curve (dashed); the band shows ±2 SD across resampled batches, drawn only where we estimate the curve from data.
We draw no band across the shaded middle. There, the curve is a straight line between two estimated points, and the middle is the part of each curve we know least. The shaded middle is narrower for pH (25 to 75% completion) than for the other three acids (15 to 80%). In Must mode, pH stays in line with the start of the batch up to about 25% completion, and in FinW mode with its end from about 75%; the other acids drift away sooner, so the calibrated readings are used over a narrower range.
The adjusted MUF reading is not yet the end. Two more steps follow; Figure 7 shows, on the 2023 Cabernet Sauvignon, what the values look like after each.
Averaging in the calibrated readings. Where a calibrated reading exists — Must early, FinW late — it is averaged with the adjusted MUF reading, each weighted by how noisy it has proved to be. In the 2023 Cabernet Sauvignon, this moves half the values by less than 0.01 g/L and none by more than 0.16 g/L (Figure 7, middle). The result is the OA value.
Light smoothing. Successive readings still jump around by more than the wine can. Each value is replaced by a local straight-line fit through its neighbors in the same batch. Neighbors count less the farther away they are in completion — the weight halves at about 9 percentage points — and, in the cold soak and wherever completion stands still, the farther away they are in days, halving at about 0.9 days. Each reading counts in proportion to its proven precision. In the 2023 Cabernet Sauvignon, smoothing moves a typical value by 0.05 g/L; the largest change, 0.45 g/L, occurs at the end of the cold soak, where total acidity jumps by more than 1 g/L within a day and smoothing rounds the corner (Figure 7, right).
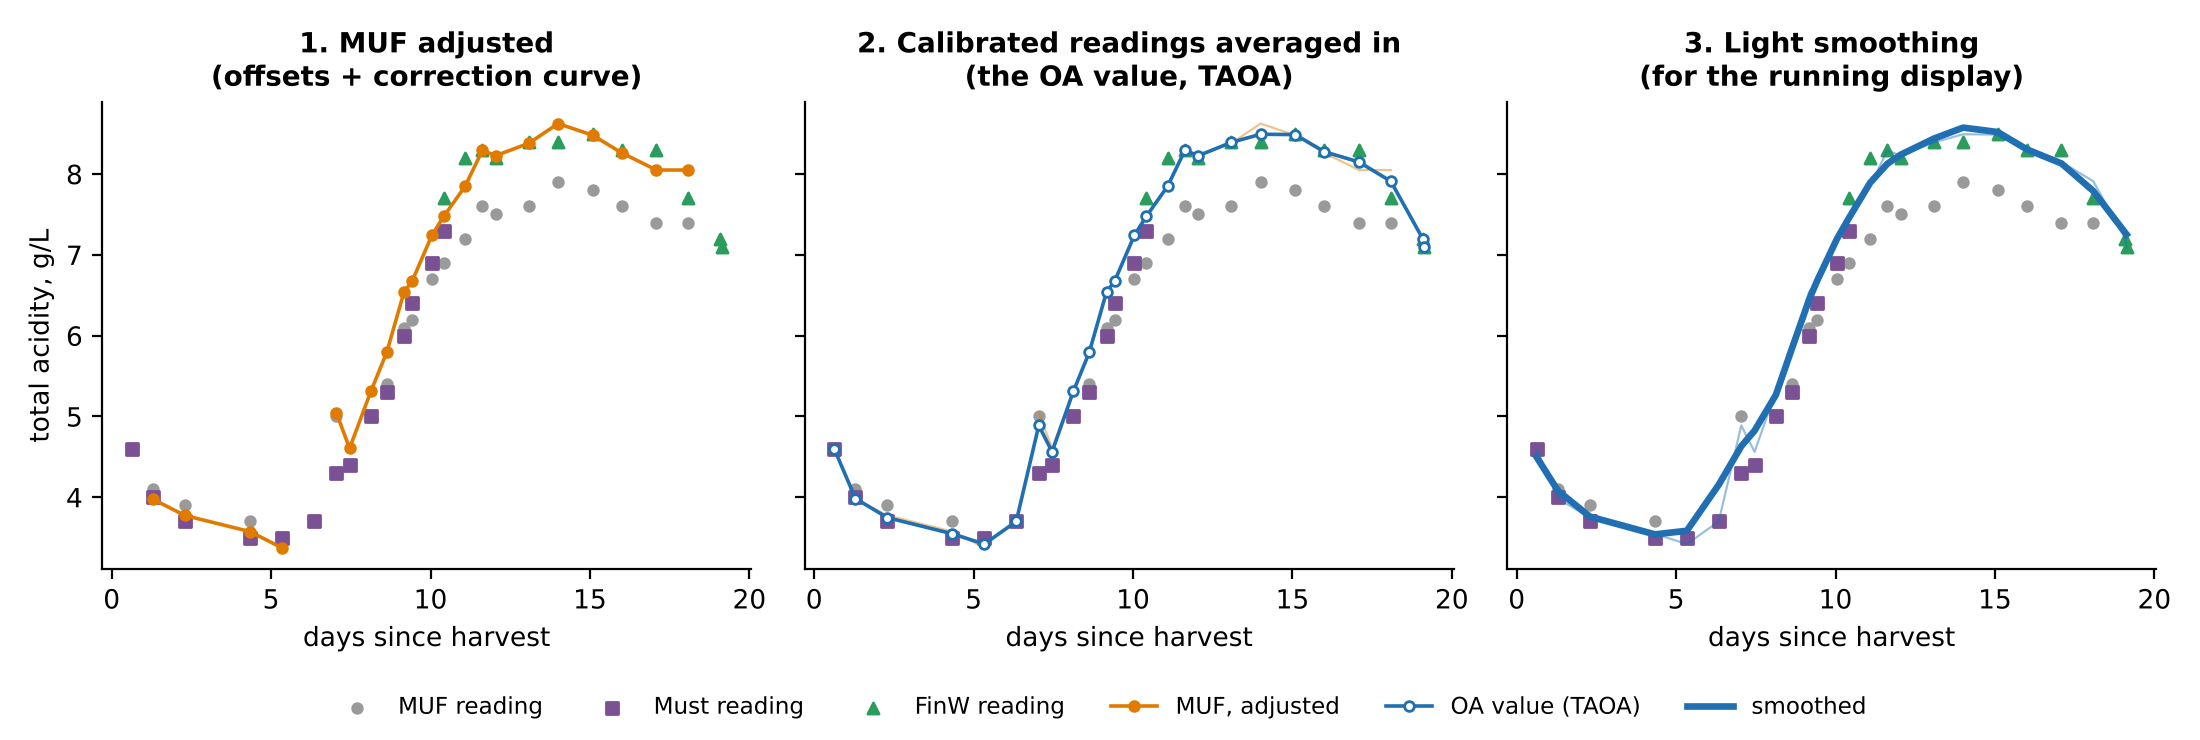
Figure 7. Total acidity in the 2023 Cabernet Sauvignon, step by step. Left: the MUF reading with the start and end offsets and the correction curve applied. Middle: the calibrated readings averaged in where they exist — the OA value. Right: after the light smoothing.
We remove tartaric additions before smoothing and put them back afterward, so they remain as steps. The trajectories below are fitted to the OA values before smoothing; the trajectory fit smooths in its own way. The running display uses the smoothed values during a ferment, and Figure 8 tests them.
The clock for these adjustments is completion, not time. Arranged by completion, the pH offset scatters by 0.067 around its curve; by days or by temperature-adjusted time, by 0.093. At the same completion, warm and cool batches show the same offset. The offset follows what is in the sample—how much sugar is left, how much alcohol has formed—and density measures exactly that.
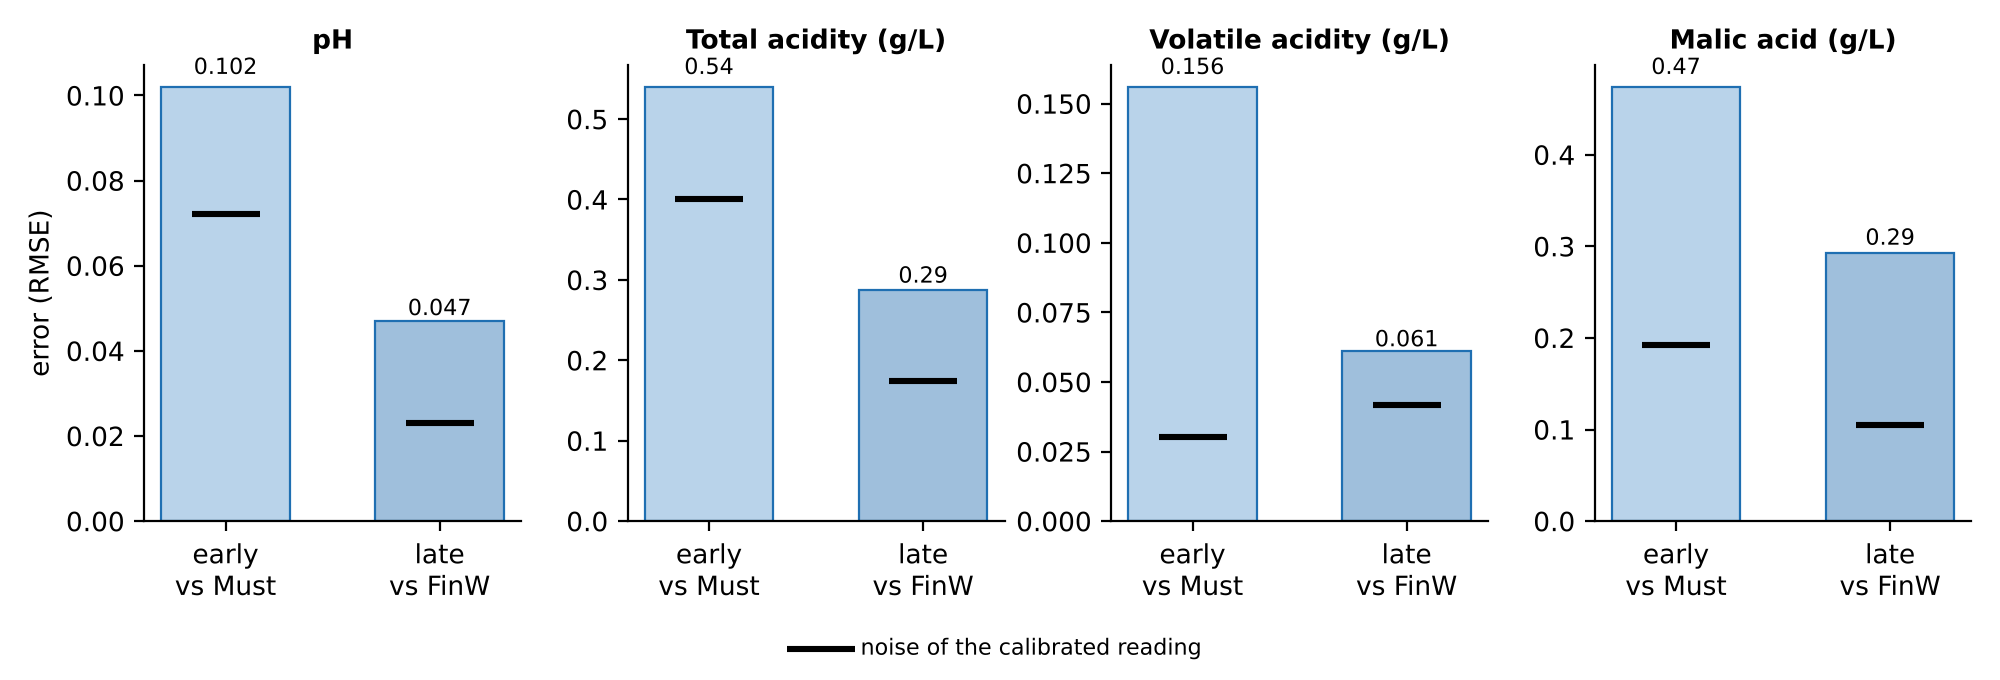
Figure 8. How close the estimate comes to calibrated readings it was not given: Must readings early in the fermentation, FinW readings late. We left each batch out of the fitting in turn. Black marks: the noise of the calibrated reading itself.
To test the calibration, we left out each batch in turn, refitted the correction curves on the others, and compared the batch's estimates with its own calibrated readings. Early in fermentation, the error is 0.10 pH, 0.54 g/L total acidity, 0.16 g/L volatile acidity, and 0.47 g/L malic acid; later, it is 0.047 pH, 0.29 g/L, 0.061 g/L, and 0.29 g/L. Late in fermentation, the error is 1.5 to 3 times the noise of the FinW reading itself. The average error is close to zero for pH, volatile, and malic acid; total acidity reads 0.12 g/L low late in the fermentation.
Sugar and alcohol need no such step. Alcohol has no Must reading, and FinW sugar reads 13 g/L against 20 on MUF until the wine is dry, so neither has a calibrated reading in the middle of the ferment to calibrate against. Both follow density closely.
We call the proxy-calibrated values pHOA, TAOA, VAOA, and MalicOA; the trajectories below are fitted to them.
Trajectories
The next step is to draw trajectories through the observed/adjusted measurements, thus replacing point measurements with a curve specified by parameters and easily comparable across fermentation batches.
The right Clock for Kinetics: Temperature-Adjusted Time
Chemistry runs faster at elevated temperatures. A day of cold soak at 50 °F barely moves the needle; a day of vigorous fermentation at an excessive 95 °F accomplishes a great deal. So calendar time — days since harvest — is the wrong yardstick for how far a ferment has progressed. Two batches that are three days in can be in entirely different places if one was kept cold and the other warm. That temperature governs extraction is well established in the winemaking literature [2, 3, 5].
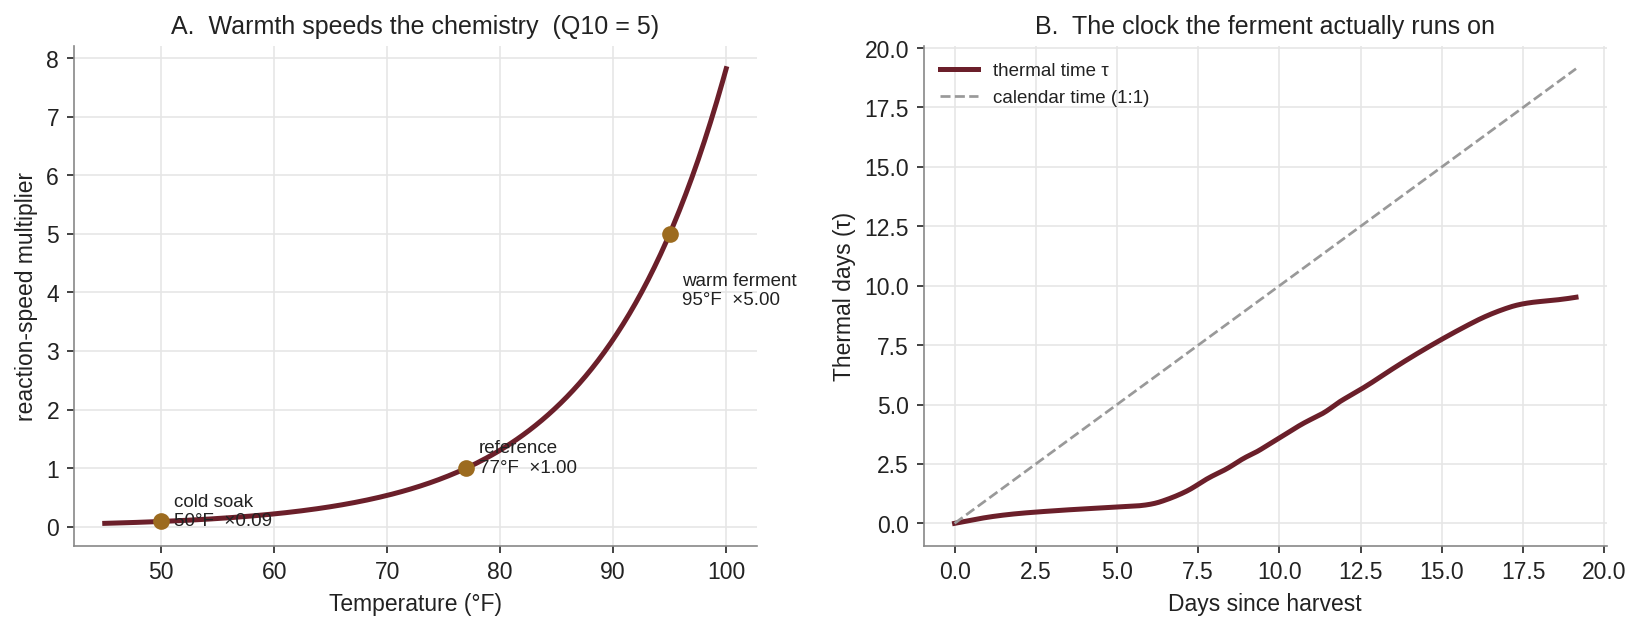
Figure 9. (A) The chemistry runs faster when it is warm: each observed temperature becomes a speed multiplier. A cold-soak day at 50 °F counts for about a tenth of a reference day; a warm fermentation day at 95 °F counts for five. (B) Adding those multipliers up gives "thermal time" τ. For this 2023 Cabernet, the cold soak barely advances the clock, then warm primary fermentation races ahead of the calendar.
We fix this by stretching and compressing the clock according to temperature. Every observed temperature is turned into a speed multiplier:
f(T) = Q10 ^ ( (T − 77 °F) / 18 )
Three numbers set the scale: a reference temperature (77 °F, where the multiplier is exactly one), the 18 °F that corresponds to a 10 °C step (the rule is conventionally stated per 10 °C), and Q10 — the factor by which the rate rises for each such step. Summing these multipliers over the fermentation gives thermal time, written τ ("tau"). A warm day contributes several thermal days; a cold-soak day a fraction of one.
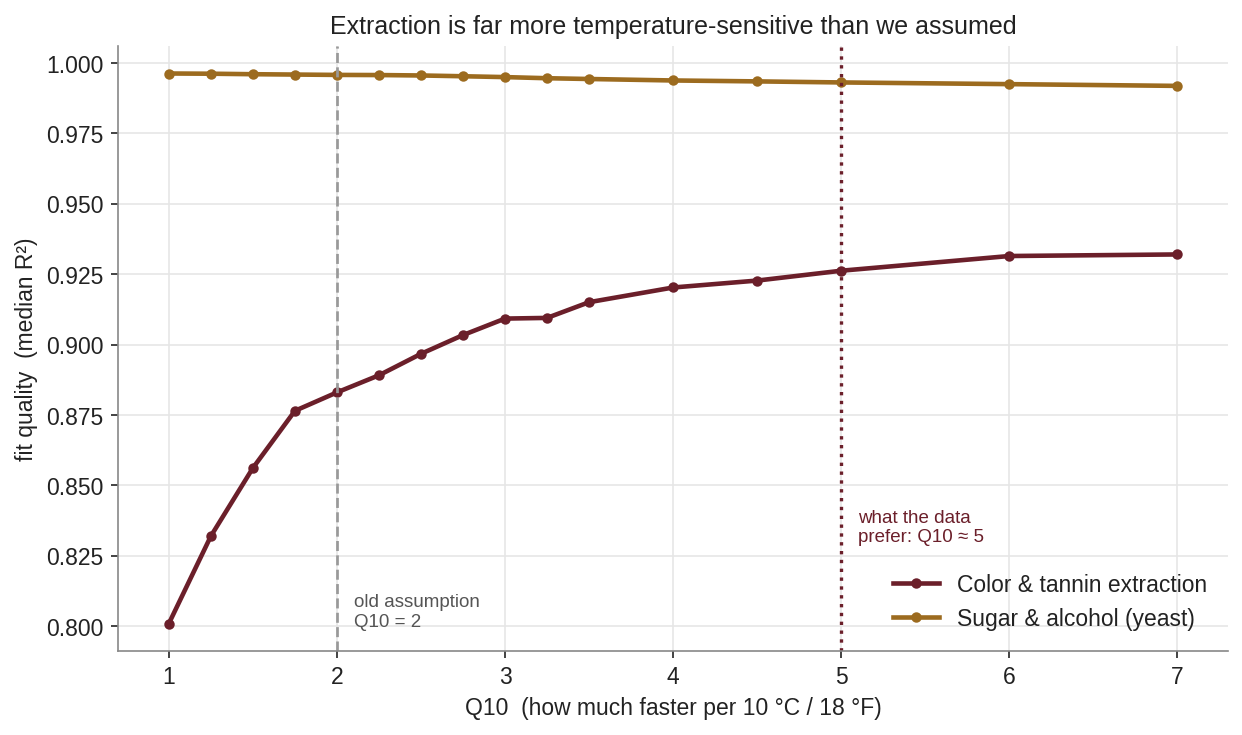
Figure 10. Fit quality as the temperature-sensitivity Q10 is varied. Sugar and alcohol barely care. Color and tannin extraction clearly prefer a much steeper Q10—around 5—than the textbook value of 2.
How temperature-sensitive is the chemistry — what is Q10? The textbook default is 2, meaning the rate doubles every 10 °C. We let our own data choose: we refit every batch across a range of Q10 values and asked which produced the cleanest curves. For sugar and alcohol — the yeast's work — Q10 hardly matters to the fit. But for color and tannin extraction, the data clearly prefer a far steeper Q10, around 5 to 7. Extraction roughly quintuples, rather than doubles, for each 10 °C. Pulling pigment and tannin out of the skins depends on skin cell breakdown, which heat accelerates sharply—a temperature dependence that mechanistic extraction models capture through activation energies [5]. We use Q10 = 5 for all trajectories. The preference for a steep Q10 is just as strong in batches that never saw a cold soak.
So the ferment runs on two clocks. Temperature-adjusted time is the clock for the chemistry—how fast sugar falls and color comes out. Completion, computed from density, is the clock for the OenoFoss adjustment. The adjustment depends on what the sample is made of—how much sugar is left and how much alcohol has formed—and density tracks exactly that, whatever the temperature.
One Curve per Process: The Model Families

Figure 11. Chemistry-matched curve shapes, each with three or four parameters.
A good model curve should match the chemistry it describes, with as few adjustable parameters as possible. We use six shapes, each with precedent in the food- and wine-science literature:
Logistic — the sugar curve falls in an S — slow at first while the yeast establish themselves, fast in the middle, slow again as the last sugar is consumed; alcohol is its mirror image. The logistic form is a standard description of fermentation kinetics [6].
Bateman (rise, then fall) — color is extracted quickly, peaks, then declines as pigment binds to other compounds or precipitates. This "appears, then disappears" behavior is what extraction studies report for anthocyanins [3, 5], and the classic mathematical shape for it is the Bateman curve [7]. It fits free, bound and total anthocyanins.
Weibull rise — tannins lag through the cold soak, then climb steeply once fermentation heats the tank, then level off.
Saturating — total phenolics climb quickly and then level off at a plateau [2, 3].
Quadratic — acidity, pH, volatile acidity and malic acid drift gently and are described by a parabola, with a tartaric term for acidity and pH.
Quadratic valley — nitrogen dips as the yeast consume it and rises again after nutrient additions; the curve is pinned to the first and last reading.
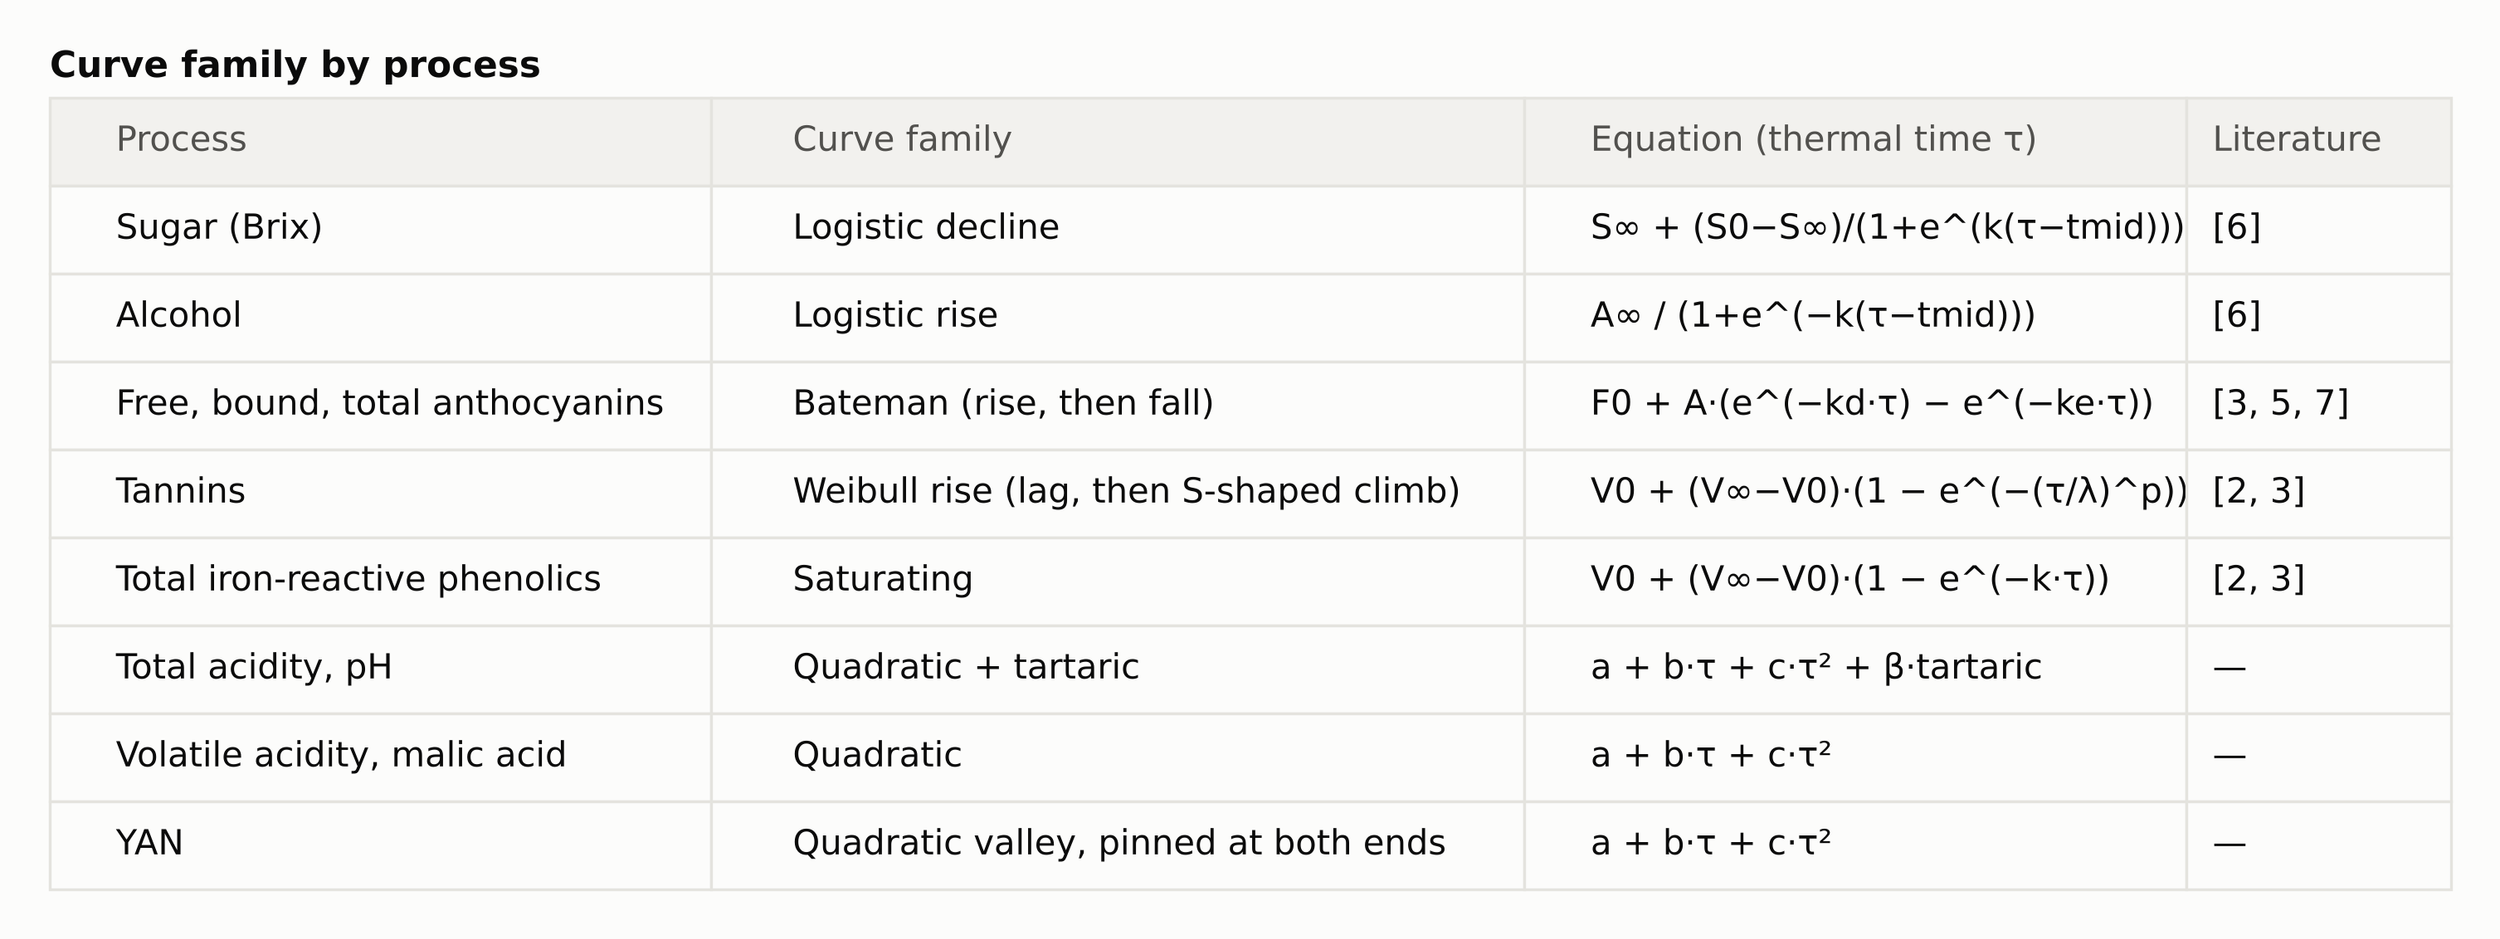
Table 1. Curve family by process, with supporting literature (see References).
Reading the Parameters
Each shape carries a handful of parameters—typically three or four—and those parameters are exactly the compact summary we were after. We give each a plain-language name so the numbers make sense at a glance.
Figure 12 shows the trajectory and measurements of free anthocyanins for the 2023 Cabernet Sauvignon fermentation (the color curve); Table 2 is the full dictionary.
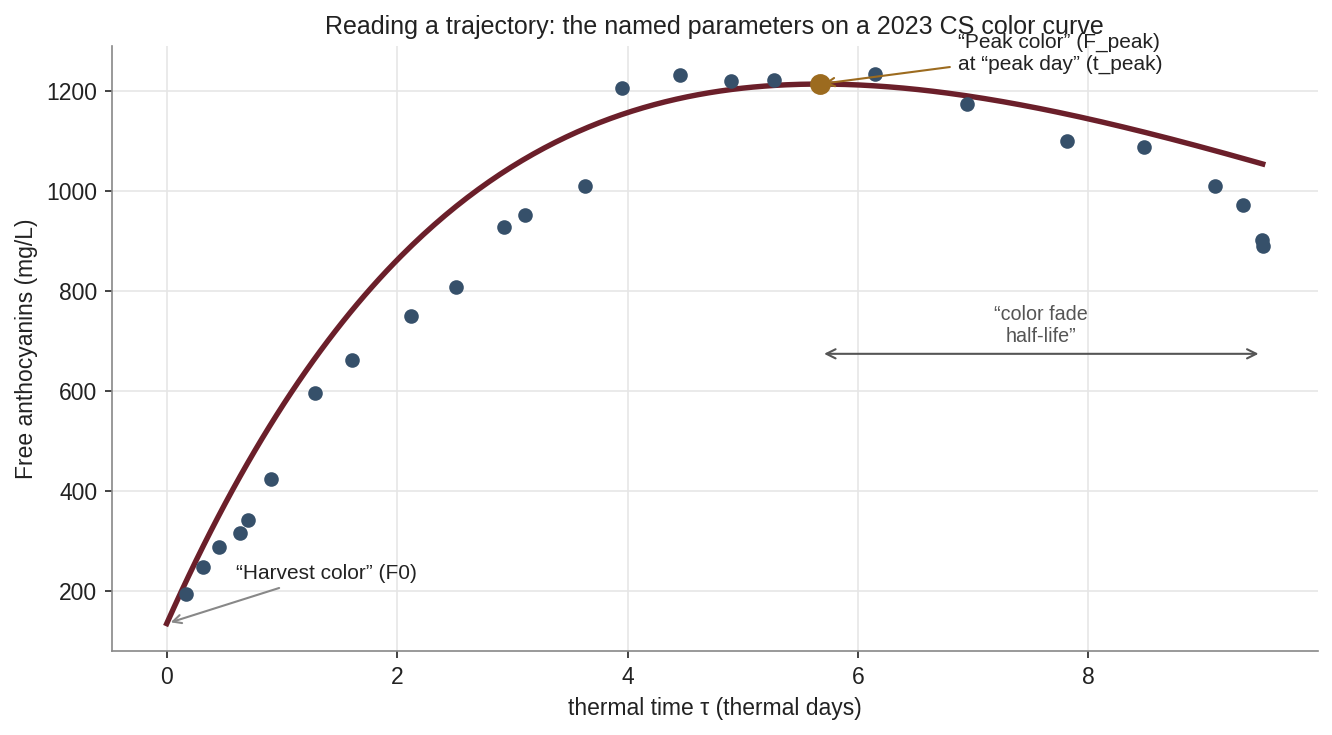
Figure 12. The named parameters on the 2023 Cabernet free-anthocyanin (color) curve: harvest color, the peak and the day it occurs, and the half-life of the fade afterward.
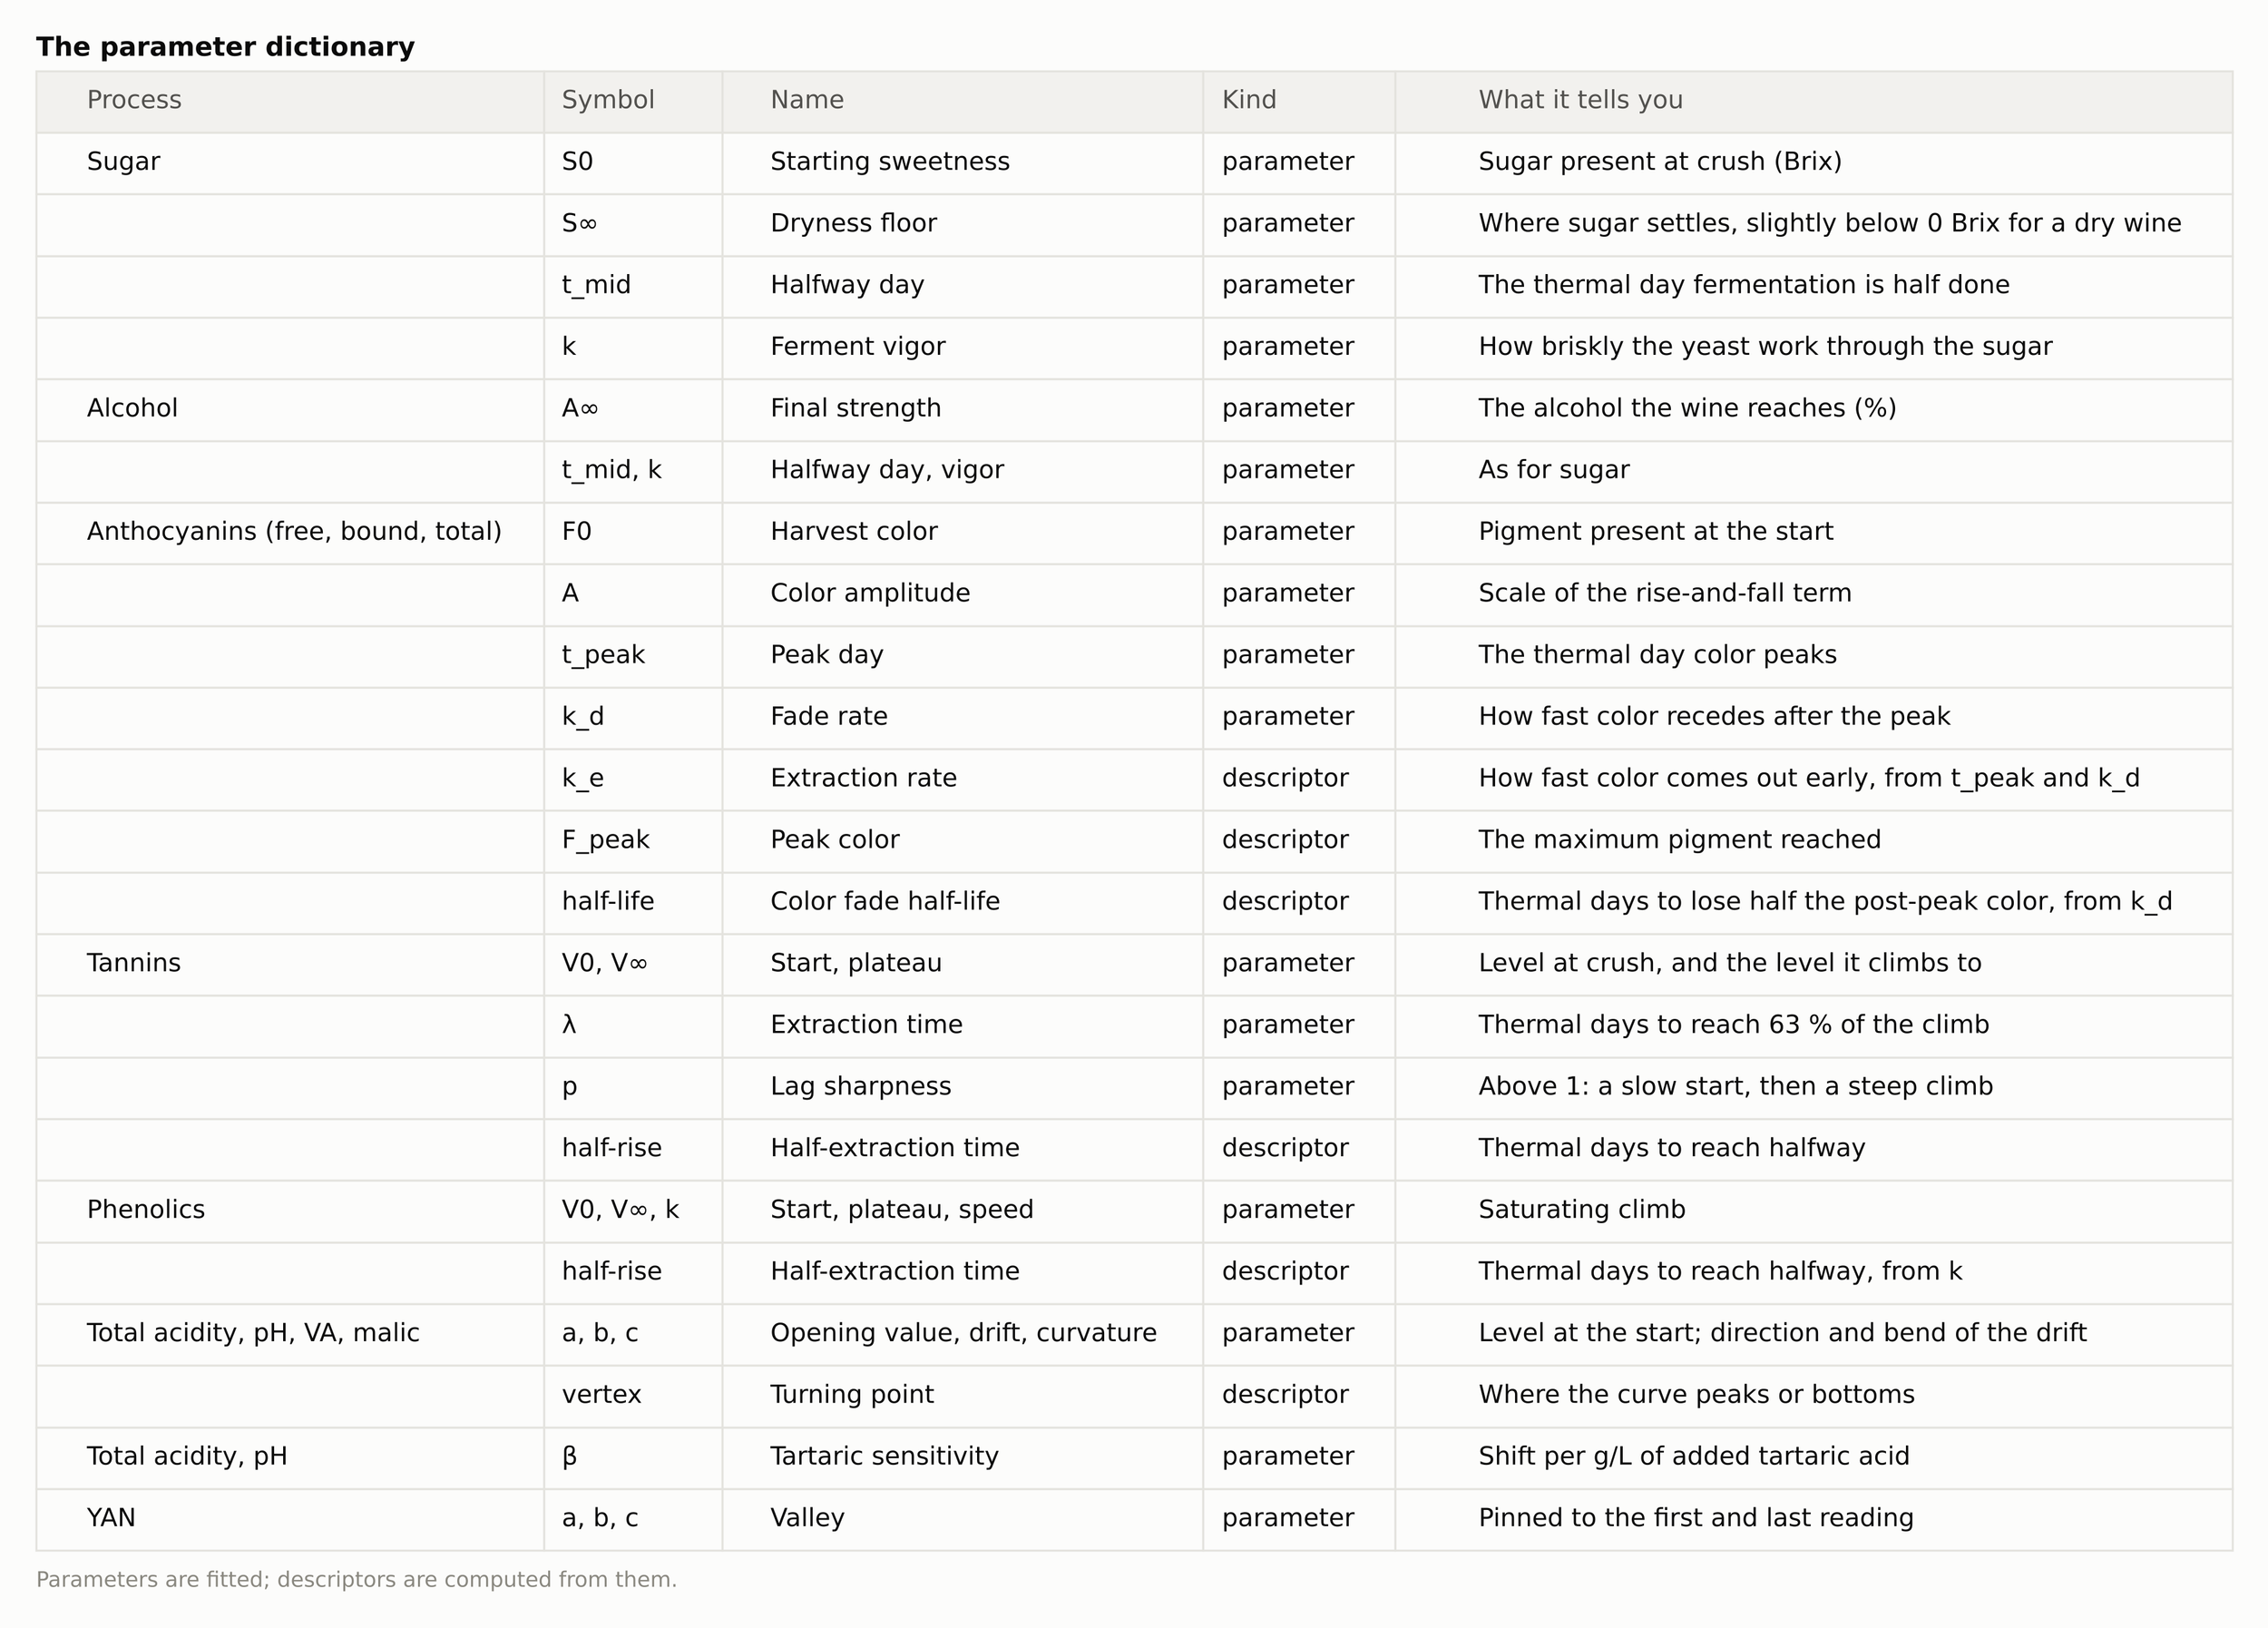
Table 2. The parameter dictionary. Parameters are fitted; descriptors are computed from them.
Fitting the Curves — A Fermentation Fingerprint
To fit a batch, we compute its thermal-time clock once, then, for each quantity, find the curve parameters that best match the measured points by least squares.
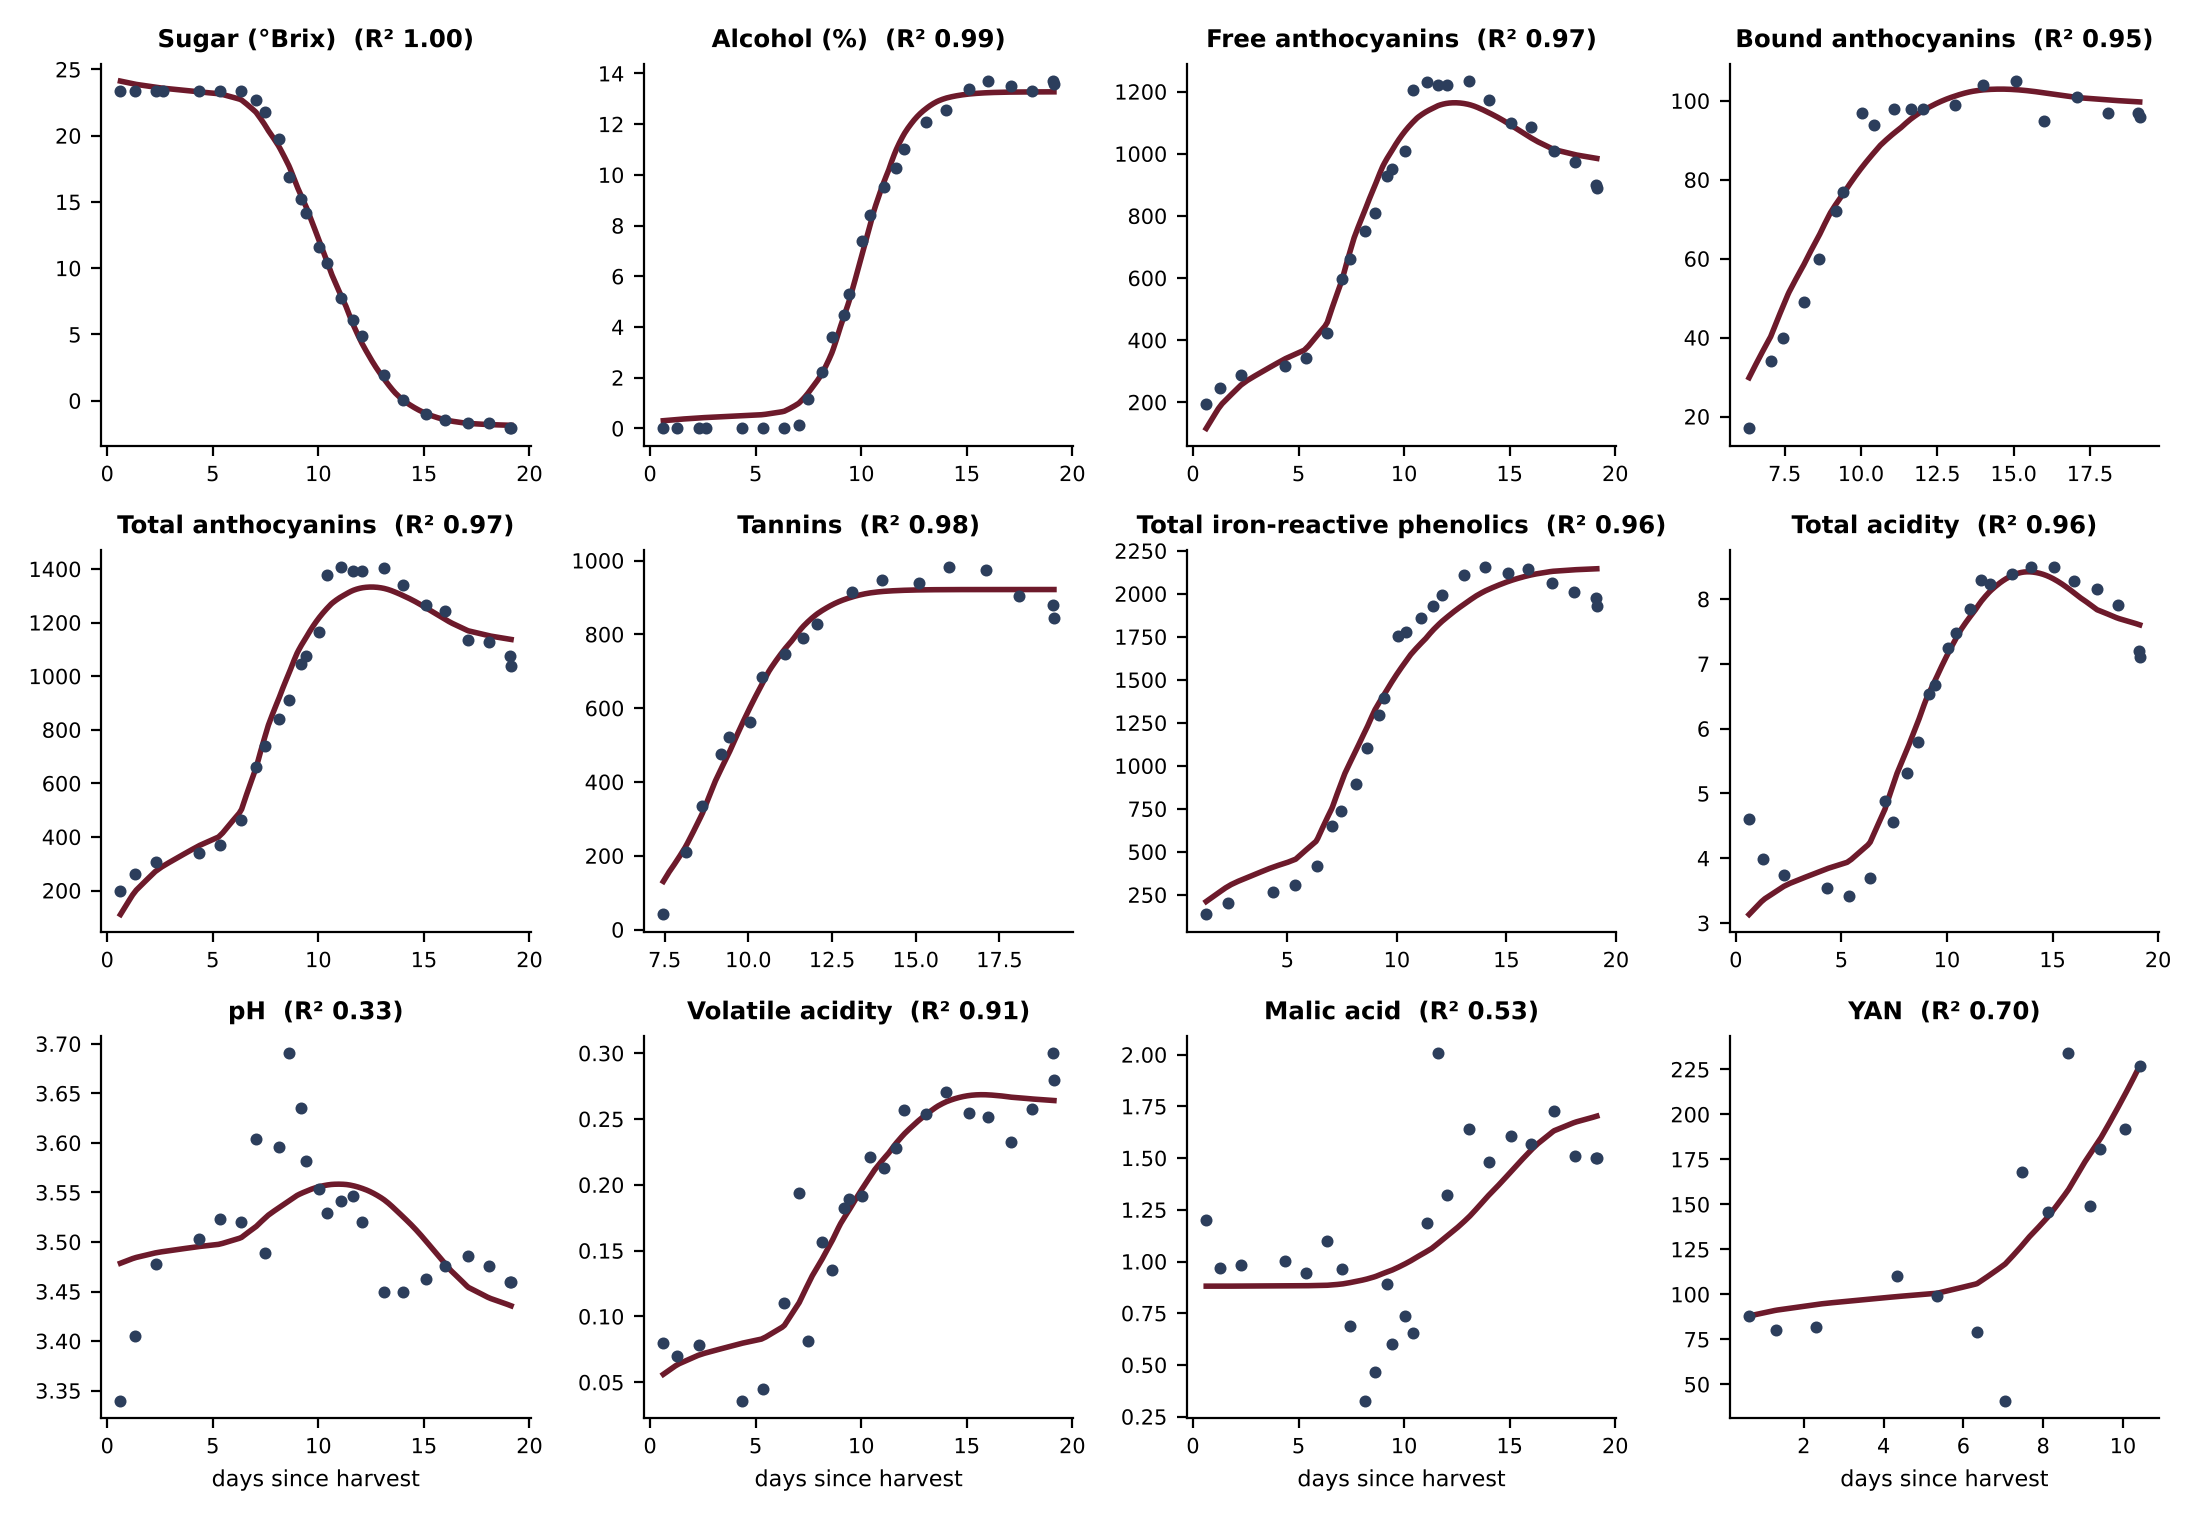
Figure 13. All twelve trajectories for the 2023 Cabernet Sauvignon — its fingerprint. Dots are measurements, lines are the fitted trajectories.
The fit also helps catch outliers. Every point more than two standard deviations from its first-pass curve is pulled back to two standard deviations, in the same direction, and the curve is fitted again. We report the second-pass curve and its parameters.
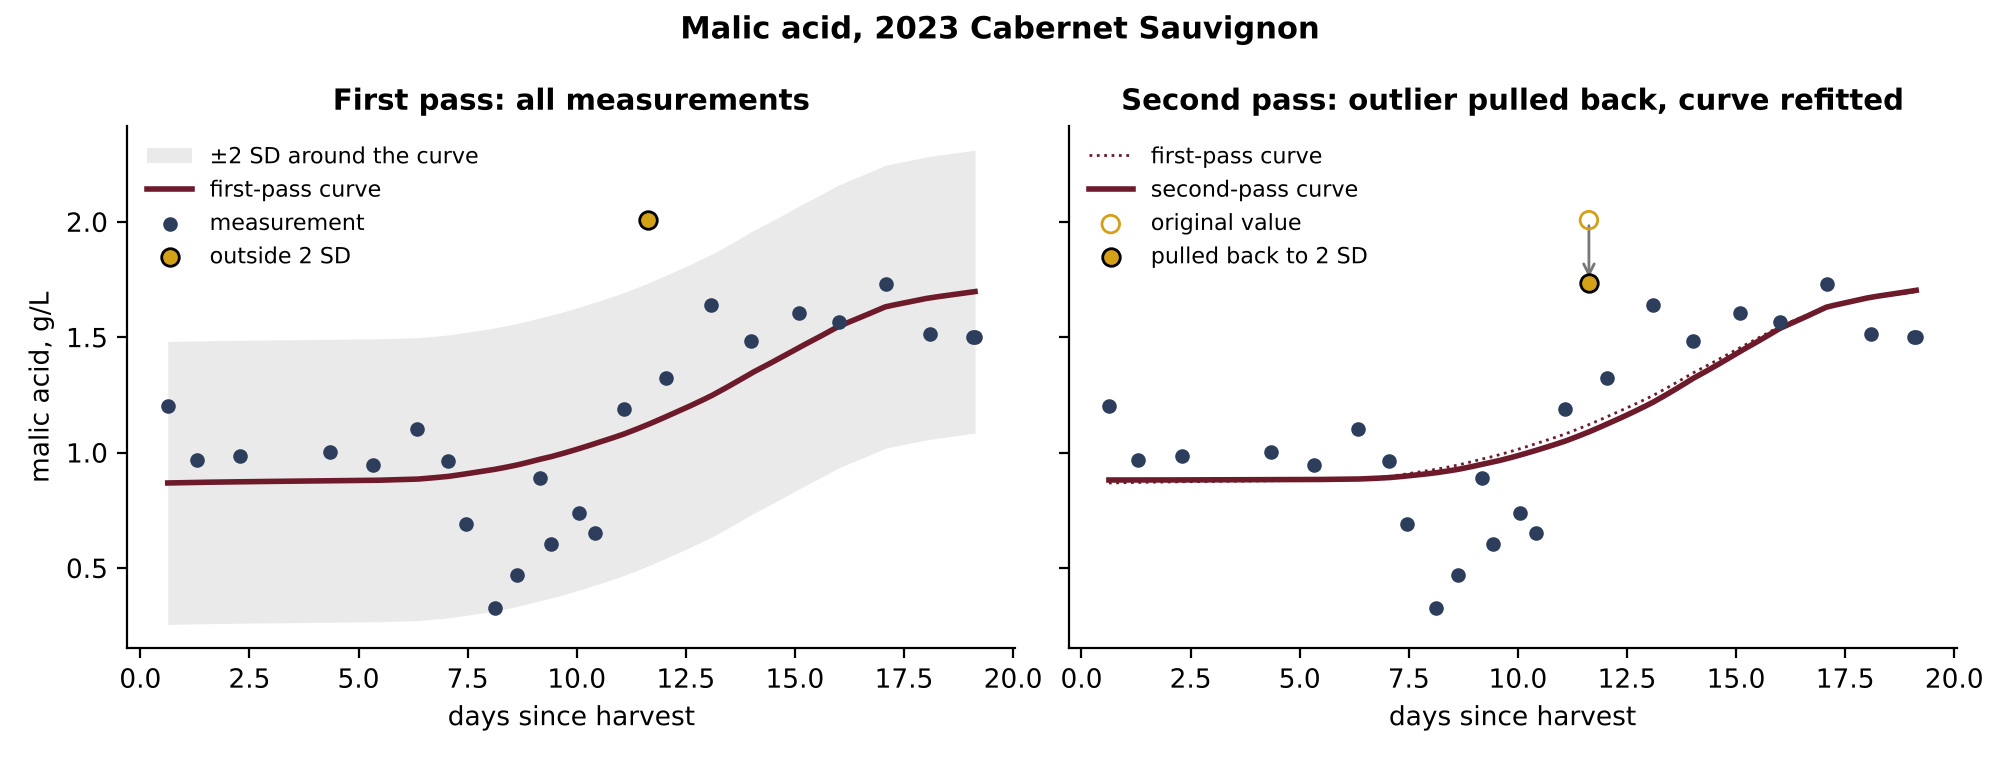
Figure 14. Two-pass fit of malic acid in the 2023 Cabernet Sauvignon. Left: the first-pass curve with a band of two standard deviations; one reading lies outside it. Right: that reading was pulled back to the edge of the band, and the curve was refitted.
In Figure 14, one malic acid reading, 2.01 g/L on day 11.6, lies 2.9 standard deviations above the first-pass curve. We pull it back to 1.73 g/L and refit the curve; the second-pass curve moves only slightly.
This is the same two-standard-deviation rule we use for the cellar trajectories and for selecting the samples that train the phenolic estimates. Across all batches and quantities, it moves 520 of 10,221 values (5 %).
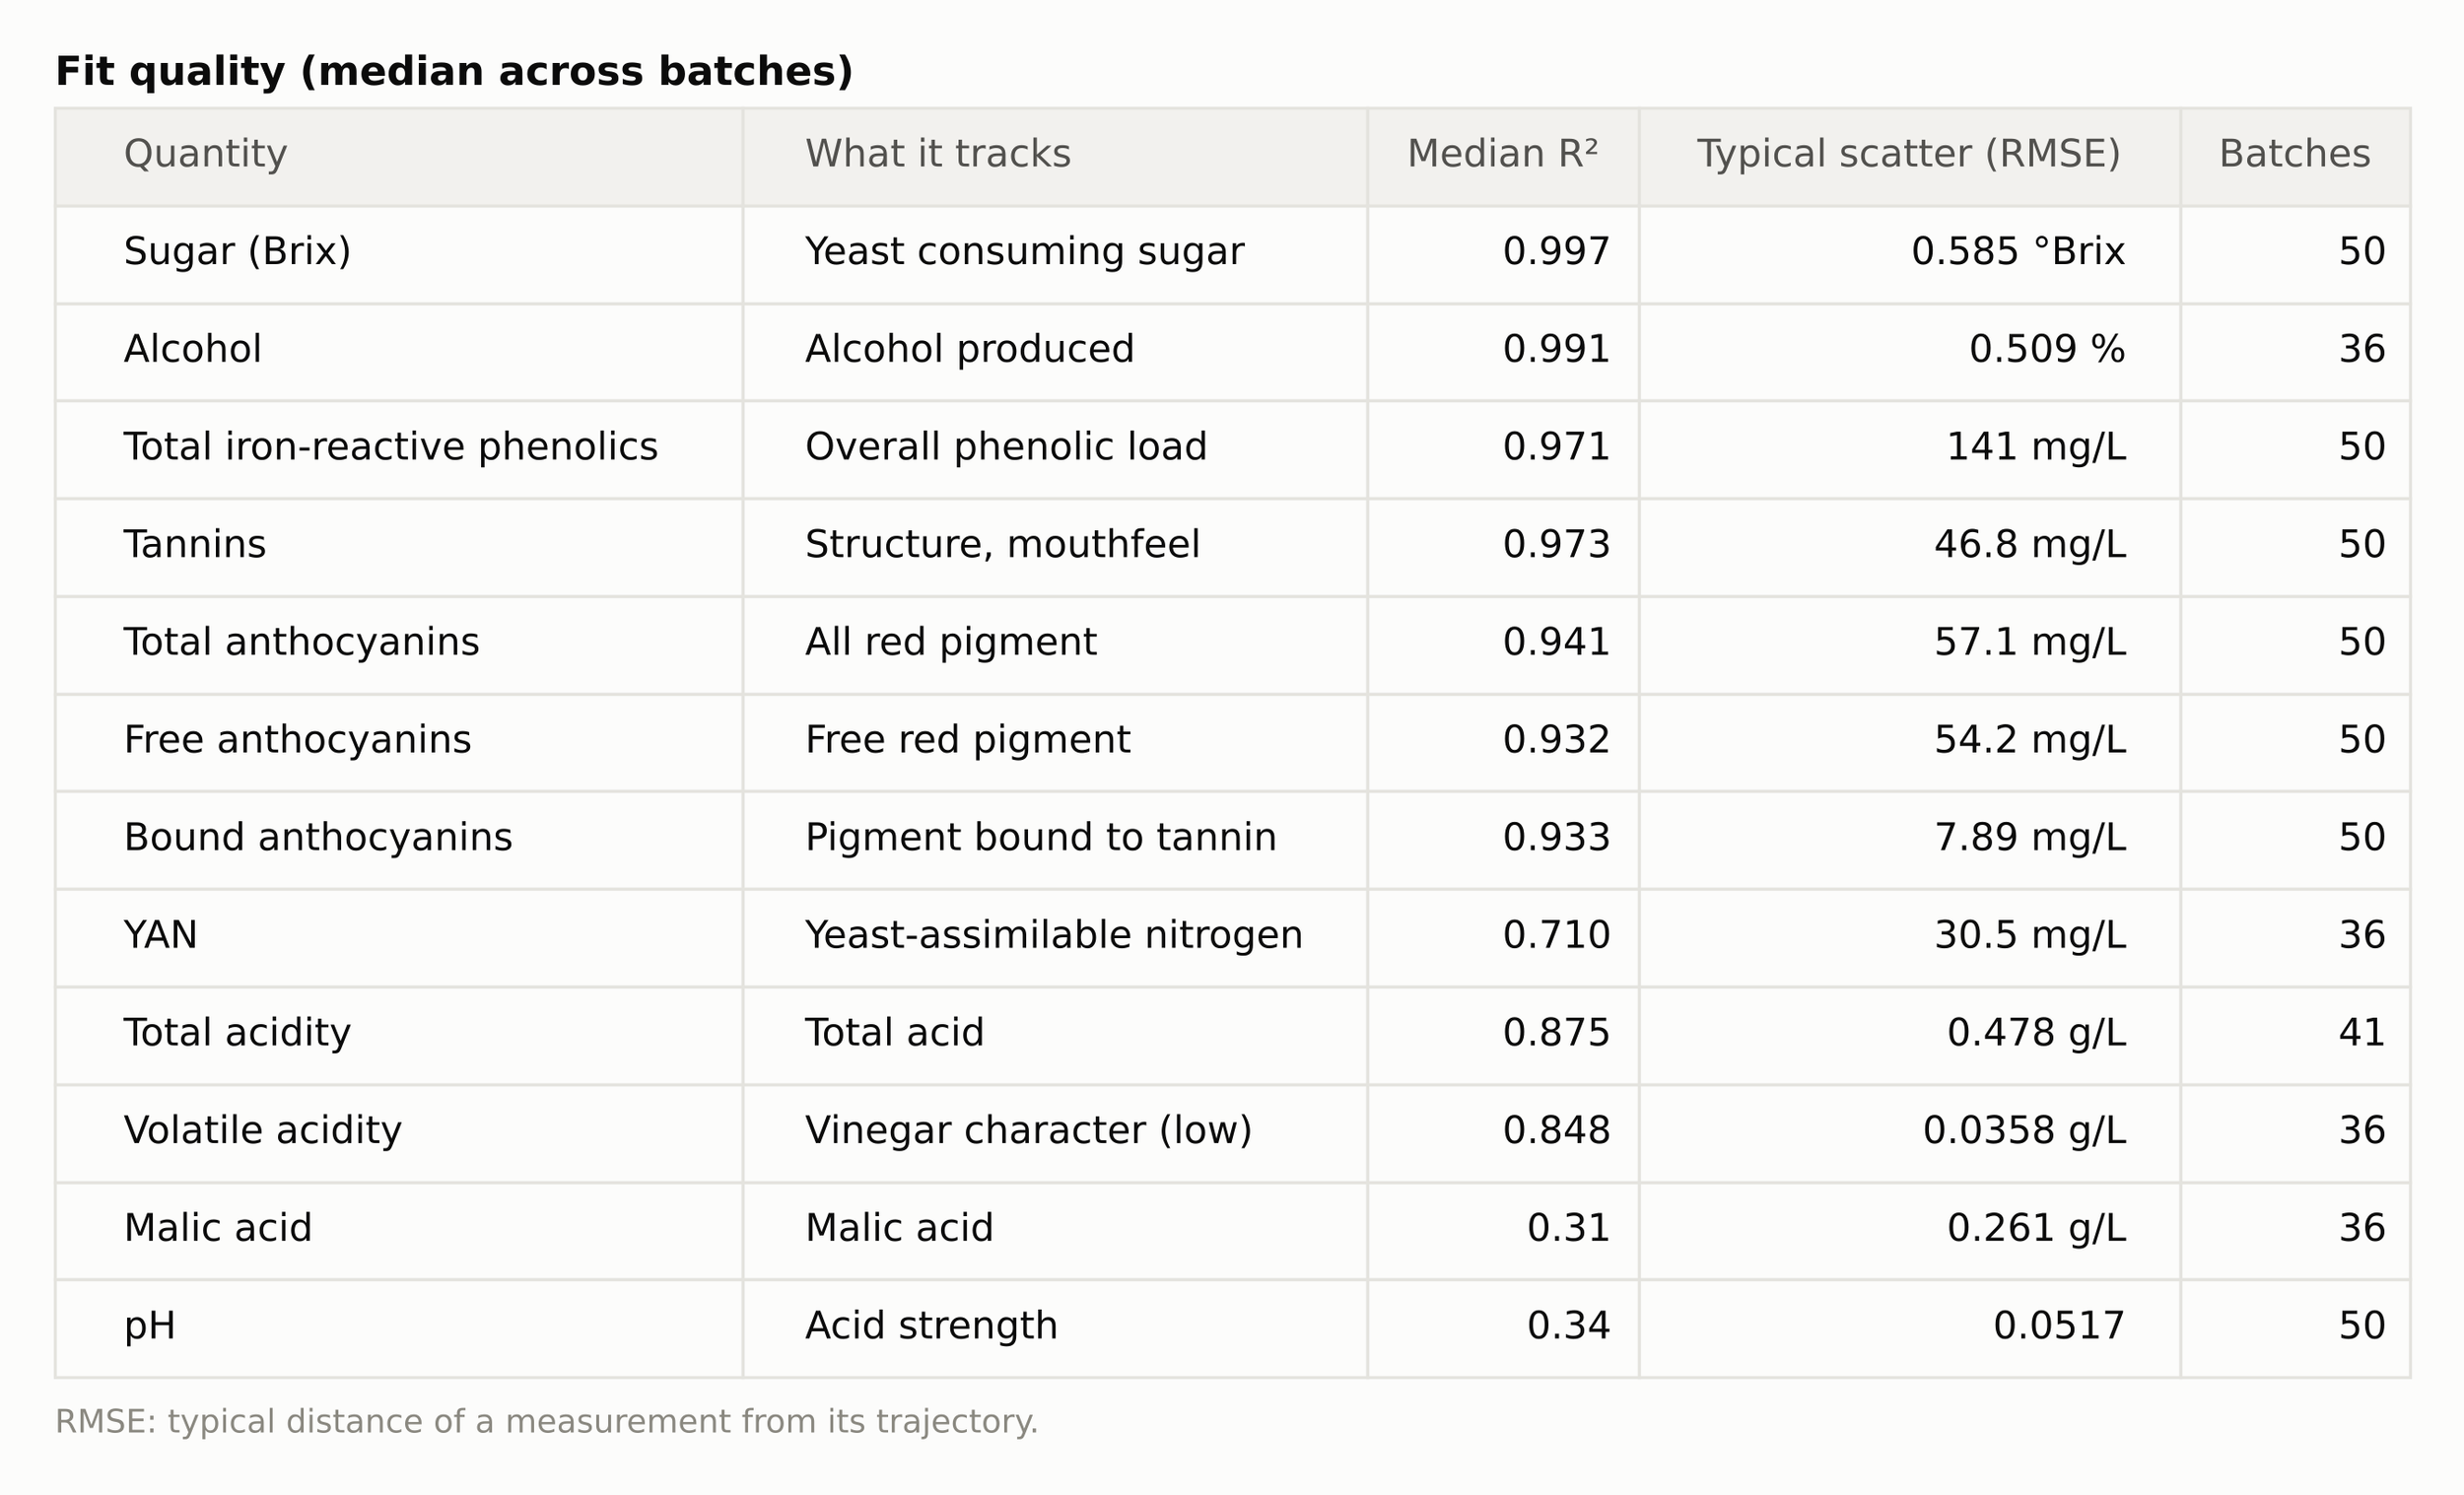
Table 3. Typical fit quality across our batches. R² is the share of the variation the curve captures; RMSE is the typical distance of a measurement from its curve.
Sugar and alcohol — the yeast's work — fit essentially perfectly, and the phenolics — the heart of red-wine quality — land between 0.93 and 0.97. Total acidity (0.88) and volatile acidity (0.85) follow their curves well. Nitrogen is weaker, with fewer readings and nutrient additions mid-fermentation. pH and malic acid score lowest, for a different reason: both barely move. pH rises about 0.07 over a fermentation when no acid is added, so there is little variation for any curve to explain; the scatter around the curves is small, 0.05 pH and 0.26 g/L. All fits for the four acids use the OA values.
The Fingerprint in Numbers
Put together, about twenty numbers define a fermentation's fingerprint. Some are parameters of the fitted curves; others are descriptors computed from them, such as the height of the color peak. The table groups them by quantity and lists each with a typical value (the median across our ferments) and the batch-to-batch range (the 10th to 90th percentile). Times are in thermal days (τ). The entire history of a fermentation, compressed into one comparable row of numbers.
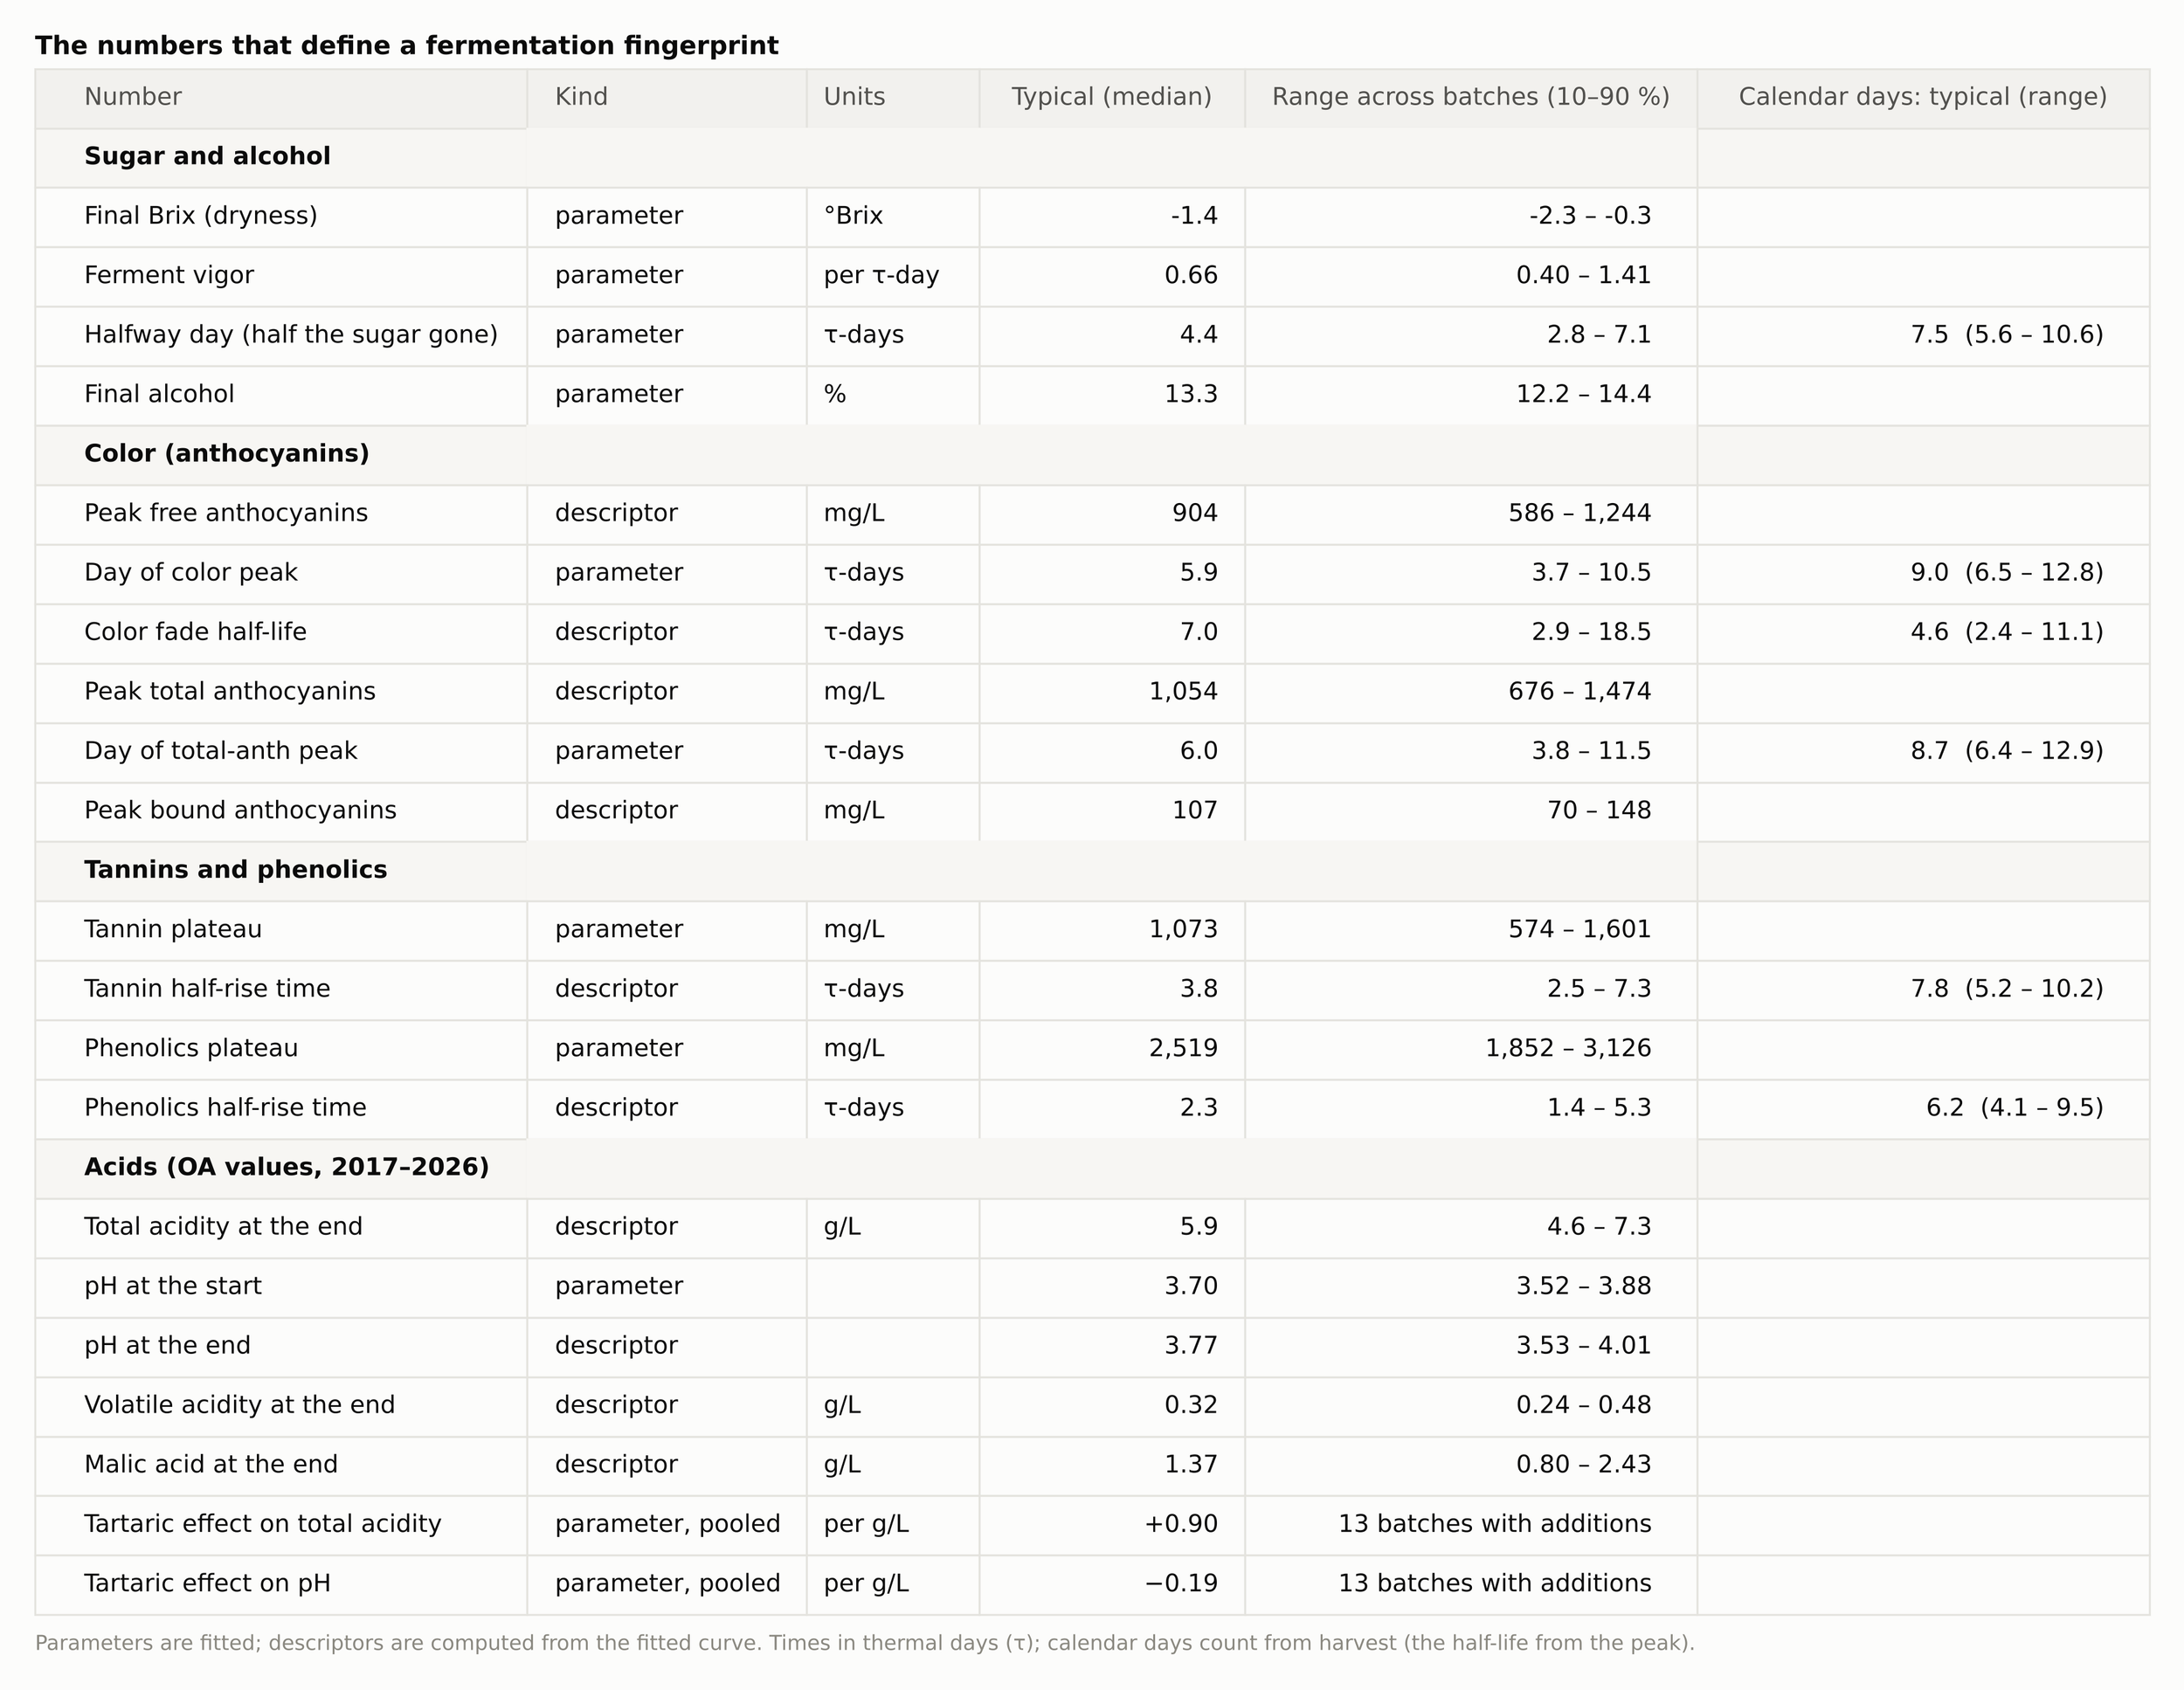
Table 4. The numbers that define a fermentation fingerprint, grouped by quantity: fitted parameters and descriptors computed from them, with typical values and batch-to-batch range.
Durations in the table are in thermal days; the last column gives the same events in calendar days since harvest, so on a typical ferment half the sugar is gone about 7.5 days after the grapes come in.
Acidity and Tartaric-Acid Additions
Acidity carries one complication the other quantities do not: we sometimes add tartaric acid to the must. An addition is not chemistry the ferment did on its own—it is something we did to it—and it appears as a step up in total acidity and a step down in pH. For pH and total acidity, the model takes our additions as an explicit input: we record the tartaric added, and the curve becomes the natural trajectory plus the effect of what we poured in.
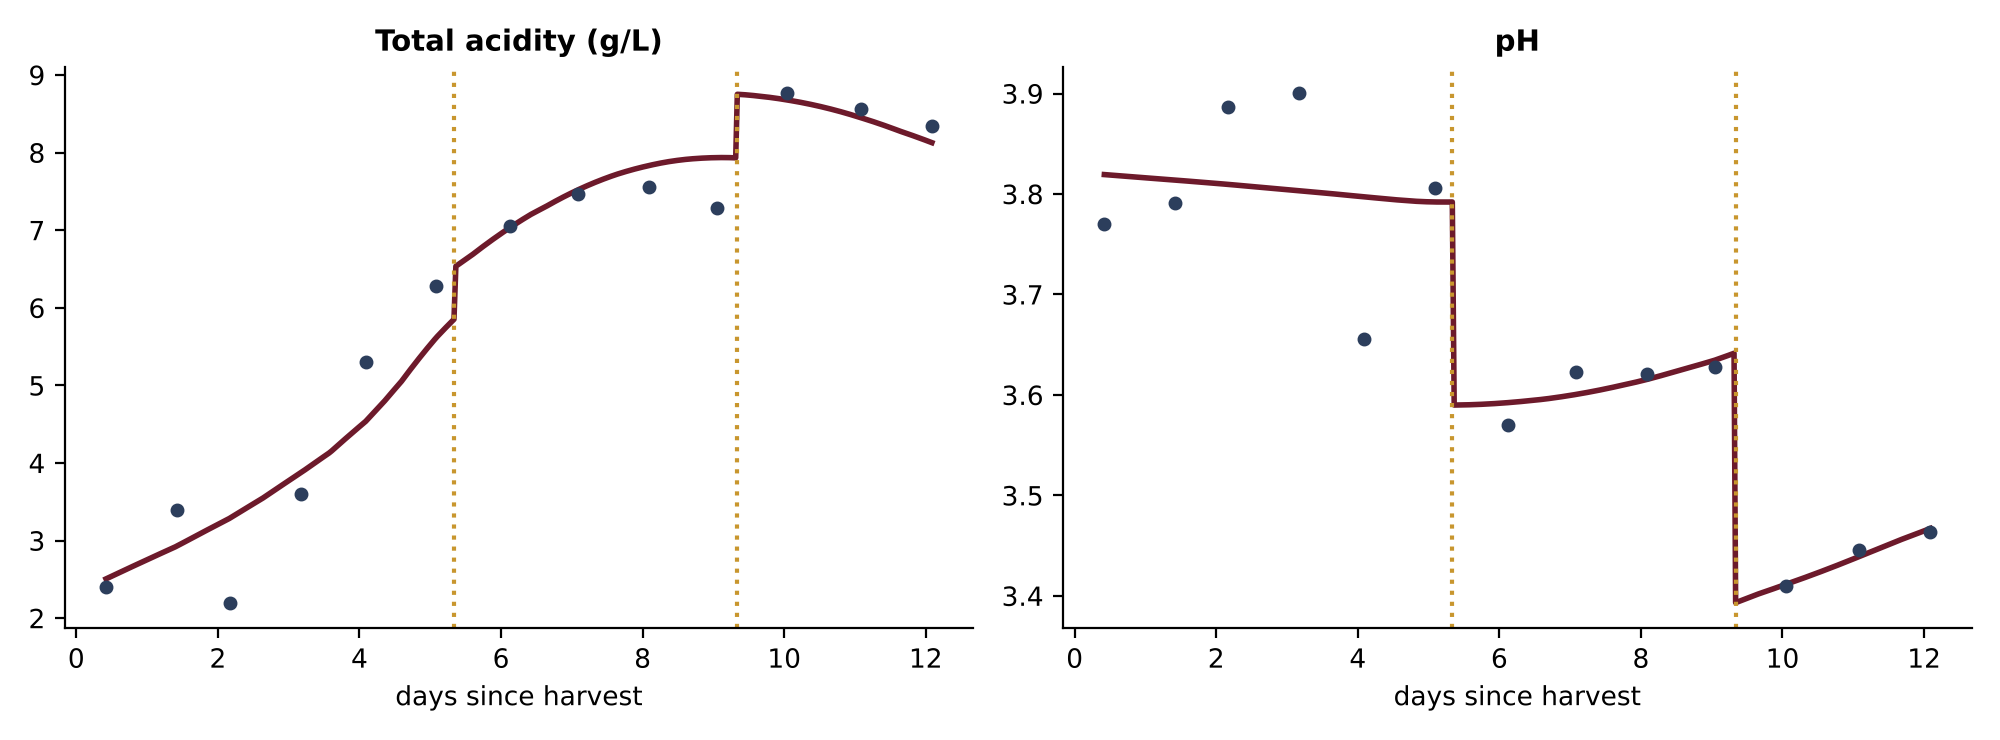
Figure 15. A 2017 Cabernet lot that received two tartaric additions (gold lines): total acidity jumps and pH drops at each. The model takes our additions as an explicit input and follows along.
Thirteen batches received additions, all between 2014 and 2019. Fitted on the OA values, each gram of tartaric acid per liter of juice raises total acidity by 0.90 g/L, close to the textbook stoichiometric expectation, and lowers pH by 0.19.
We have occasionally overdone the tartaric — the 2015 vintage remains the cautionary tale — and seeing additions cleanly separated from the natural acid drift is the hindsight this exercise is meant to give us.
How can the model be used?
Beyond identifying and correcting outliers, the trajectories help forecast the finish of a fermentation and compare fermentations.
Forecasting the Finish
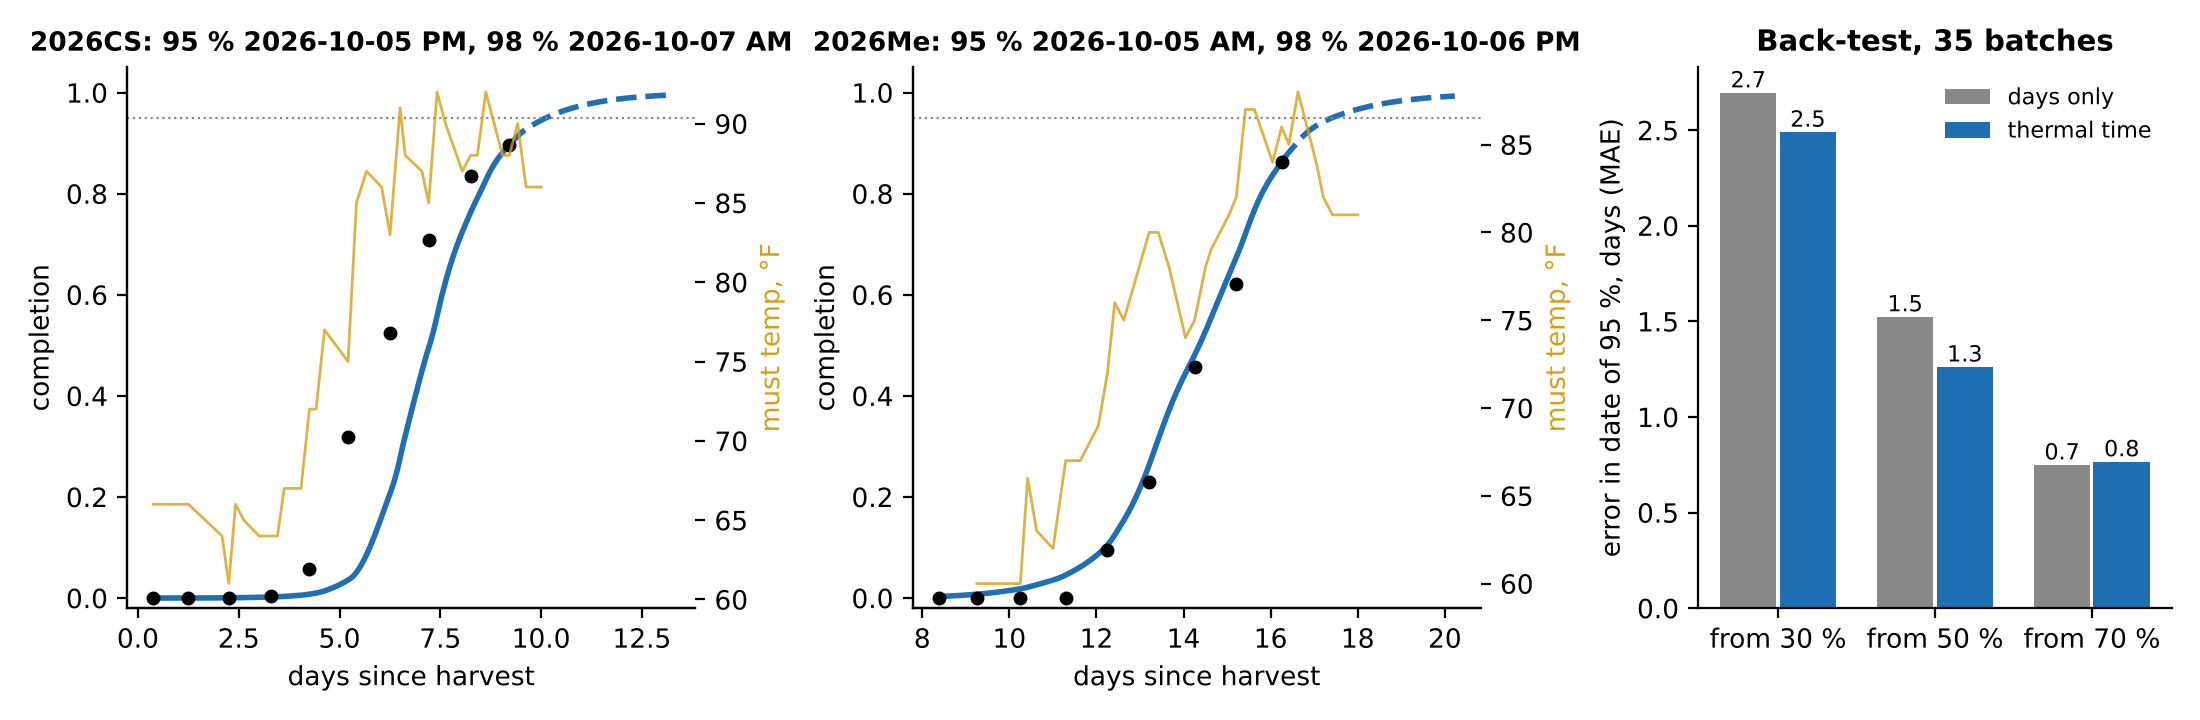
Figure 16. Left and middle: completion of the two open 2026 batches (as of October 5, 2026), fitted in thermal time and projected forward (dashed) with temperature held at its last reading. Right: error in the predicted date of 95 % completion over 35 finished batches, made from the data available at 30%, 50%, and 70 %.
The fitted curves also look ahead. We fit completion with a Gompertz curve—an S with a long tail at the top—in thermal time, anchor it on the latest reading, and project it forward with the temperature held at its last value. From 50% completion, the date the ferment reaches 95% comes out with a typical error of 1.3 days, against 1.5 days on plain calendar days, and without the late bias of almost a day that calendar days carry. Forecasting prefers a gentler temperature sensitivity than extraction, Q10 = 3.
A Family Portrait of the Vintages
Once every fermentation is reduced to the same handful of numbers, a natural question follows: do our ferments fall into families? We placed 49 fermentations in a 16-dimensional fingerprint space and used principal component analysis to collapse them into the two directions along which they differ most. Ferments that sit close together behave alike.
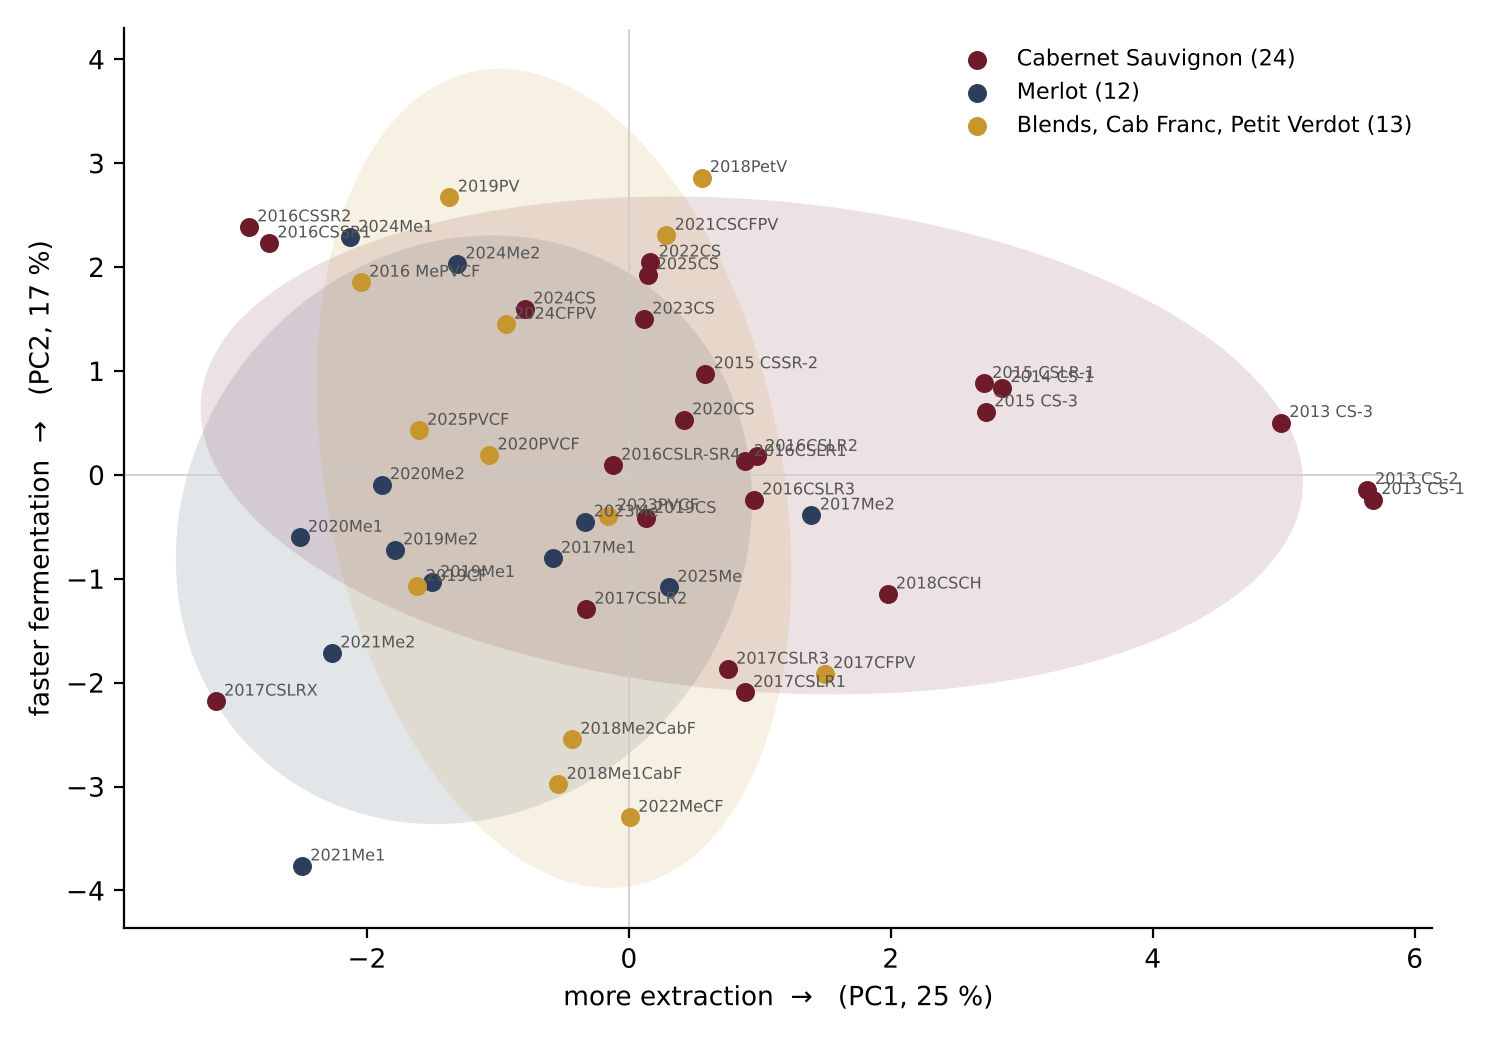
Figure 17. Each point is one fermentation, placed by its fingerprint—shaded: 1.8-σ regions by grape.
The horizontal axis tracks extraction—peak color, bound pigment, and tannin —increasing to the right. The vertical axis tracks pace—an early halfway day and fast tannin and phenolic extraction toward the top. Together, the two directions capture 42% of the variation; the fingerprint is many-sided, and this picture is a flattened shadow of it.
Merlot sits on the low-extraction side, Cabernet Sauvignon on the high side, and the blends with Cabernet Franc and Petit Verdot between them. All three spread widely in pace. The earliest Cabernet vintages, 2013 to 2015, sit apart on the far right—a reminder of how much our methods have changed since then. We do not read much into the exact boundaries; fifty fermentations is a modest sample.
Prior Art
We checked thirty-four published items against the claims in this note; the full list, with what we could and could not verify, is in the Appendix. The companion note on reading phenolics from spectra carries its own prior art on the accuracy of spectral estimates, and that subject is left there.
Where it agrees: That a fermenting sample needs its own calibration is the official position: the OIV guidelines for infrared analyzers treat unfermented must, fermenting must and dry wine as separate matrices and warn against relying on a calibration outside the range it was built on. Moreira and Santos trace errors in infrared wine analysis to ethanol and organic acids overlapping in the spectrum, and Urtubia and colleagues, who built calibrations on fermenting Cabernet Sauvignon must, found they transferred poorly to other varieties. That an offset fixes most of the error is also published: Swanepoel, du Toit and Nieuwoudt took global WineScan calibrations to local grape must and cut the error in total acidity from 3.13 to 0.49 g/L with a simple slope-and-intercept adjustment, against 0.51 g/L for a calibration rebuilt from scratch; pH went from 0.10 to 0.05. Our start and end offsets follow the same idea, but depend on completion. The accuracy we reach is in line with calibrations built for fermenting must: Magerman's, on 284 fermenting tanks, reached 0.04 pH, 0.07 g/L volatile acidity and 0.35 g/L total acidity, against our 0.047, 0.061 and 0.29 late in the fermentation — though ours is measured against the FinW reading, not a wet laboratory.
On the chemistry, the AWRI reports that total acidity rises in red ferments — from succinic acid, by 1.2 g/L on average where it rose — and that red-wine pH is likely to rise during fermentation, as ours does by 0.07. Commercial wine yeast degrade little malic acid (Volschenk and colleagues; 18 % for one strain and little for another in Redzepovic and colleagues), so the 1.98 g/L by which MUF over-reads malic acid at the finish is the instrument, not the ferment. Tartaric additions behave in a pilot trial by Gómez and colleagues almost exactly as in our cellar. Before fermentation, the first gram per liter lowered pH by 0.21 and raised total acidity by 0.90 g/L, against our 0.19 and 0.90.
The temperature results agree in their order. Coleman, Fish and Block's kinetic model of wine fermentation has the yeast's growth rate rising about six-fold from 11 to 35 °C, with a Q10 of about 2.2—the textbook value we find the sugar curves do not argue with. For pigment, the published temperature sensitivity is steeper: Miller and colleagues fit the loss of anthocyanins with an activation energy of 107 kJ/mol, a Q10 of about 4.3 between 20 and 30 °C, and Setford and colleagues found the diffusion of pigment out of the skins about ten times faster at 23 °C than at 4 °C. The shapes agree too. Bautista-Ortín and colleagues followed three varieties: anthocyanins peaked on day 6 in Cabernet Sauvignon and Syrah and day 8 in Monastrell and then declined slowly. At the same time, seed tannin started slowly and accelerated as alcohol formed — the rise-then-fall and the lagged climb we fit. Panprivech and colleagues found only 41 to 48 mg/L of tannin at the end of a cold soak at 10 °C (50 °F), versus 547 to 676 mg/L at the end of fermentation, consistent with a cold-soak day counting for about a tenth of a reference day for tannin.
Where it disagrees, or refines: The same cold-soak study saw anthocyanins peak after five days at 10 °C, far faster than a tenth of a reference day per day allows; color is less temperature-bound in the cold soak than our single Q10 assumes. Lerno and colleagues found that warmer fermentations raise the rate of skin extraction but not its end point, while for seed tannin both rise; stretching the clock changes rates only, so the tannin plateau's temperature dependence is not in our model. The Q10 of about 5 we find for color sits closest to Miller's pigment-loss reaction, not to extraction, so our net color curve probably carries both. Gómez's trial also shows the effect of an addition shrinking through fermentation—at the end, per gram per liter, pH 0.11 lower and total acidity 0.66 g/L higher—as tartaric precipitates as potassium bitartrate; only 35 to 43% of what was added was still measurable. Our model treats each addition as a permanent step and likely overstates the final result. In that trial, the untreated control's pH fell from 3.79 to 3.57 during fermentation, while ours rose. And the climb of total acidity in our 2023 Cabernet Sauvignon — about 5 g/L from the cold soak to the peak, in Must and FinW readings alike — is larger than the largest rise the AWRI reports, 3.0 g/L. A few laboratory titrations mid-ferment would show how much of it is real.
What we did not find published: No evaluation of the OenoFoss "Must under Fermentation" mode, and no correction of infrared readings that depends on completion or density — Swanepoel's slope-and-intercept adjustment is the nearest relative. No activation energy or Q10 for anthocyanin or tannin extraction during fermentation, as opposed to their loss. No thermal-time adjustment to put fermentation curves on a common clock, and no Bateman or Weibull curve fitted to pigment or tannin; studies describe peaks and lags but do not fit a shape to them. Forecasts of fermentations exist as classifications—Urtubia and colleagues judged from the first three days whether 24 industrial ferments would finish normally—and as whole-curve fits (Coleman, Nelson and Boulton), but we found none that test the error in a predicted finishing date from partial data. Nor did we find a fingerprint like the one in Table 4 that we could compare across more than a decade of vintages; the closest method is multiway principal component analysis for monitoring batch processes in chemical plants (Nomikos and MacGregor). These are where the note is new — and the proxy calibration, resting on our own Must and FinW readings rather than on a wet laboratory, is also where it is most exposed.
References
[1] Boulton, R. B., Singleton, V. L., Bisson, L. F., & Kunkee, R. E. (1996). Principles and Practices of Winemaking. New York: Springer.
[2] Sacchi, K. L., Bisson, L. F., & Adams, D. O. (2005). A review of the effect of winemaking techniques on phenolic extraction in red wines. American Journal of Enology and Viticulture, 56(3), 197–206.
[3] Setford, P. C., Jeffery, D. W., Grbin, P. R., & Muhlack, R. A. (2017). Factors affecting extraction and evolution of phenolic compounds during red wine maceration and the role of process modelling. Trends in Food Science & Technology, 69, 106–117.
[4] Setford, P. C., Jeffery, D. W., Grbin, P. R., & Muhlack, R. A. (2019). Mathematical modelling of anthocyanin mass transfer to predict extraction in simulated red wine fermentation scenarios. Food Research International, 121, 705–713.
[5] Miller, K. V., Noguera, R., Beaver, J., Medina-Plaza, C., Oberholster, A., & Block, D. E. (2019). A mechanistic model for the extraction of phenolics from grapes during red wine fermentation. Molecules, 24(7), 1275.
[6] Wang, D., Xu, Y., Hu, J., & Zhao, G. (2004). Fermentation kinetics of different sugars by apple wine yeast Saccharomyces cerevisiae. Journal of the Institute of Brewing, 110(4), 340–346.
[7] Bateman, H. (1910). The solution of a system of differential equations occurring in the theory of radioactive transformations. Proceedings of the Cambridge Philosophical Society, 15, 423–427.
[8] FOSS. OenoFoss wine analyzer, product information. https://www.fossanalytics.com/en/products/oenofoss
[9] Chateau Hetsakais. OenoFoss for basics. https://www.chateauhetsakais.com/oenofoss
Appendix: Papers Checked for Prior Art
Our October 2026 search found the items below. Each entry ends with what was actually retrieved — full text, abstract, a summary, or the citation only — and nothing marked citation-only is quoted for a number anywhere in the note. Several publishers' pages were closed to us during the search; where we could not confirm a DOI, the entry says so and carries no link.
Measuring acids with an infrared analyzer during fermentation.
1. OIV (2010). Guidelines on infrared analysers in oenology, resolution OIV/OENO 390/2010. Unfermented must, fermenting must, dry wine, liqueur and sweet wine are separate matrices; a calibration cannot be relied on outside its range; bias correction against reference methods is allowed. Agrees with the need to calibrate during the fermentation. Full text. oiv.int
2. Urtubia, Pérez-Correa, Meurens & Agosin (2004), Talanta 64(3):778–784. Infrared calibrations on fermenting Cabernet Sauvignon must for sugars, ethanol, glycerol, and six organic acids; mean relative error 4.8 %, malic the worst at 8.7 %; transfer to other varieties less reliable. Agrees. Abstract. doi.org/10.1016/j.talanta.2004.04.005
3. Magerman (2009). MSc thesis, Stellenbosch University (not peer-reviewed). Calibrations on 284 fermenting tanks, 2007–2009: error 0.04 pH, 0.07 g/L volatile acidity, 0.35 g/L total acidity (rated unsatisfactory for quantification). Our corrected readings are about the same. Abstract. hdl.handle.net/10019.1/2754
4. Moreira & Santos (2004), Analytica Chimica Acta 513:263–268. Spike-recovery tests on an infrared wine analyzer: good for total acidity spiked with tartaric acid, poor for acetic additions and for sugars in dry wine; overlap with ethanol and organic acids blamed. Agrees that the matrix moves the readings. Abstract. doi.org/10.1016/j.aca.2003.09.029
5. Swanepoel, du Toit & Nieuwoudt (2007), South African Journal of Enology and Viticulture 28(2):140–149. Global WineScan calibrations on local must: total acidity error 3.13 g/L, 0.49 after a slope-and-intercept adjustment, 0.51 rebuilt; pH 0.10, 0.05, 0.04. Agrees strongly with offset correction. Abstract. doi.org/10.21548/28-2-1467
6. Spinardi, Beghi, Sambo, Longoni & Valenti (2021), Acta Horticulturae 1311:69–74. The OenoFoss evaluation found: grape must only; pH; total acidity and malic acid against titrator and HPLC; R² 0.77 to 0.99. Silent on fermentation. Abstract. doi.org/10.17660/ActaHortic.2021.1311.9
7. Di Egidio, Sinelli, Giovanelli, Moles & Casiraghi (2010), European Food Research and Technology 230(6):947–955. Near- and mid-infrared spectra with principal component analysis to find the critical points of eight small fermentations. Background: no acid accuracies. Abstract. doi.org/10.1007/s00217-010-1227-5
8. Patz, Blieke, Ristow & Dietrich (2004), Analytica Chimica Acta 513. Infrared wine calibrations transferable between instruments of the same build, comparable to reference methods. Background. Abstract; DOI not confirmed.
Acids during fermentation and tartaric additions.
9. AWRI, "Acidity and pH" (Ask the AWRI; not peer-reviewed). Total acidity usually falls during fermentation as bitartrate precipitates; in red ferments, it rises from succinic acid, 1.2 g/L on average, to 3.0 g/L; red pH is likely to rise. Agrees on the direction; our 2023 climb is larger. Full page. awri.com.au
10. Chidi, Rossouw, Buica & Bauer (2015), South African Journal of Enology and Viticulture 36(3):316–327. Tartaric, malic and citric acid fall by roughly 10 to 20 % during fermentation; succinic acid production depends on the strain. Refines. Abstract and parts of the text; DOI not confirmed.
11. Redzepovic and colleagues (2003), International Journal of Food Microbiology 83(1). Malic acid degraded during fermentation by 18 % (S. cerevisiae 71B), little by EC1118, 90 % by S. pombe. Agrees that the yeast leave malic acid largely alone. Abstract; pages and DOI not seen.
12. Volschenk, van Vuuren & Viljoen-Bloom (2006), South African Journal of Enology and Viticulture 27(2):123–136. Commercial Saccharomyces strains degrade malate poorly, with relatively minor changes in total acidity. Agrees. Abstract. doi.org/10.21548/27-2-1613
13. Boulton (1980), American Journal of Enology and Viticulture 31(1):76–80. Titration recovers only some of the acid protons because of potassium and sodium exchange; pH is predicted within 0.1- 0.2. Background on why pH and total acidity move differently. Summary only.
14. Harbertson & Harwood (2009), American Journal of Enology and Viticulture 60(1):43–49. Potassium in commercial red ferments peaks just after crushing, falls over about a week, then levels off. Mechanism behind small pH changes. Summary only; DOI not confirmed.
15. Gómez, Lasanta, Cubillana-Aguilera and colleagues (2015), BIO Web of Conferences 5:02007 (OIV congress). Tartaric acid at 0, 1, and 4.05 g/L in about 25 L: before fermentation, the first gram lowered pH by 0.21 and raised total acidity by 0.90 g/L; after fermentation, the effect per gram had shrunk; 35 to 43 % of the added tartaric remained measurable. Agrees with our coefficients, refines them over time. Full text. doi.org/10.1051/bioconf/20150502007
Temperature, extraction and curve shapes.
16. Coleman, Fish & Block (2007), Applied and Environmental Microbiology 73(18):5875–5884. Temperature-dependent model of nitrogen-limited wine fermentation, 11 to 35 °C; growth rate rises about six-fold over that range (Q10 about 2.2); yield and saturation constants show no temperature dependence. Agrees for sugar. Full text. doi.org/10.1128/AEM.00670-07
17. Miller, Noguera, Beaver, Medina-Plaza, Oberholster & Block (2019), Molecules 24(7):1275 — reference [5]. Anthocyanin loss follows Arrhenius with 107.3 kJ/mol; release constants fitted at 20 to 35 °C without an activation energy; seed tannin released at a constant rate. Refines: the steep temperature dependence is published for loss. Full text. doi.org/10.3390/molecules24071275
18. Setford, Jeffery, Grbin & Muhlack (2018), Molecules 23(9):2159. Malvidin-3-glucoside extraction from Merlot solids at 4.4, 12.2, and 23.1 °C: diffusion coefficient about an order of magnitude higher at the top temperature; ethanol raises it further. Refines: steeper than Q10 = 2. Full text; parameter table not seen. doi.org/10.3390/molecules23092159
19. Setford, Jeffery, Grbin & Muhlack (2017), Trends in Food Science & Technology 69:106–117 — reference [3]. States that the literature lacks models of mass transfer and reaction during fermentation. Supports the novelty of fitted trajectories. Abstract. doi.org/10.1016/j.tifs.2017.09.005
20. Setford, Jeffery, Grbin & Muhlack (2019), Food Research International 121:705–713 — reference [4]. Anthocyanin mass-transfer model across temperature, sugar, and ethanol, R² above 0.94. No temperature numbers in the abstract. Abstract.
21. Lerno, Reichwage, Ponangi, Hearne, Block & Oberholster (2015), American Journal of Enology and Viticulture 66(4):444–453. In Cabernet Sauvignon, warmer fermentation increased the rate of skin-phenolic extraction but not the endpoint; for seed phenolics, both rose. Refines thermal time for tannin. Abstract. doi.org/10.5344/ajev.2015.14129
22. Sacchi, Bisson & Adams (2005), American Journal of Enology and Viticulture 56(3):197–206 — reference [2]. Fermentation temperature is the dominant factor for extraction; cold soak usually has little lasting effect. Agrees. Abstract and summary. doi.org/10.5344/ajev.2005.56.3.197
23. Panprivech, Lerno, Brenneman, Block & Oberholster (2015), Molecules 20(5):7974–7989. Cold soak at 10 °C for 0 to 10 days in Cabernet Sauvignon: tannin 41–48 mg/L at the end of the soak against 547–676 at the end of fermentation; anthocyanins peaked after five days of soak; final anthocyanins did not differ; final tannin 22 % higher after ten days. Agrees for tannin, disagrees for color. Full text. doi.org/10.3390/molecules20057974
24. Bautista-Ortín, Busse-Valverde, Fernández-Fernández, Gómez-Plaza & Gil-Muñoz (2016), OENO One 50(2):91–100. Anthocyanins peaked on day 6 in Syrah and Cabernet Sauvignon and on day 8 in Monastrell, then declined slowly; total proanthocyanidins peaked on day 10 in Cabernet Sauvignon; seed tannin accelerated as alcohol formed. Agrees with the Bateman and lagged-rise shapes. Full text. doi.org/10.20870/oeno-one.2016.50.2.781
25. Koyama, Goto-Yamamoto & Hashizume (2007), Bioscience, Biotechnology, and Biochemistry 71(4):958–965. Skin compounds are extracted early; seed compounds are extracted gradually. Agrees. Abstract. doi.org/10.1271/bbb.60628
26. Ortega-Regules, Romero-Cascales and colleagues (2008), Journal International des Sciences de la Vigne et du Vin 42(3):147–156. Merlot had the lowest anthocyanin levels among the four varieties. Refines our Merlot result: a smaller pool, not necessarily poorer extraction. Summary only; DOI not confirmed.
27. Bateman (1910) — reference [7]; Wang, Xu, Hu & Zhao (2004) — reference [6]. Cited in the note for the curve forms. Citation only.
Forecasting and comparing fermentations.
28. Bisson (1999), American Journal of Enology and Viticulture 50(1):107–119. Review of stuck and sluggish fermentations. Background. Abstract. doi.org/10.5344/ajev.1999.50.1.107
29. Urtubia, Pérez-Correa, Soto & Pszczolkowski (2007), Food Control 18(12):1512–1517. 24 industrial Cabernet Sauvignon ferments, 29 compounds, principal components and clustering: the first three days tell whether a ferment will finish normally. Classifies the outcome; does not forecast a date. Abstract. doi.org/10.1016/j.foodcont.2006.09.010
30. Coleman, Nelson & Boulton (2024), Fermentation 10(8):386. Parameter estimation for whole Brix curves, error 0.10 to 0.52 Brix, temperature as an input; no test on partial data. Closest to our forecast. Full text. doi.org/10.3390/fermentation10080386
31. Zwietering, Jongenburger, Rombouts & van 't Riet (1990), Applied and Environmental Microbiology 56(6):1875–1881. The standard reference for the Gompertz growth curve we use for completion. Citation only. doi.org/10.1128/aem.56.6.1875-1881.1990
32. Nomikos & MacGregor (1994), AIChE Journal 40(8):1361–1375. Multiway principal component analysis for monitoring batch processes — the industrial relative of our fingerprint comparison. Abstract. doi.org/10.1002/aic.690400809
33. Huber (1964), Annals of Mathematical Statistics 35(1):73–101. Robust estimation; our two-standard-deviation clamp-and-refit is in this family. Citation only. doi.org/10.1214/aoms/1177703732
Searched for and not found, or not read.
An evaluation of the OenoFoss "Must under Fermentation" mode; any correction of infrared readings by completion or density; an activation energy for extraction (as opposed to loss); thermal time applied to fermentation curves; Bateman or Weibull fits to pigment or tannin; a finishing-date forecast tested from partial data; a multi-vintage fingerprint comparison in a winery. Four classic items were located but could not be read and are not used: Nagel and Wulf (1979) on anthocyanins during fermentation of Merlot and Cabernet Sauvignon, Peyrot des Gachons and Kennedy (2003) on seed and skin tannin extraction, Dartiguenave, Jeandet and Maujean (2000) on buffer capacity, and Feudale and colleagues (2002) on calibration transfer.
Draft 6, October 8, 2026
Here is link to the pdf file 2026-10-06_Modeling_the_Fermentation_draft6.pdf